Weekend Chart Summary 2-7-09
Click image for original size
Click image for original size
Click image for original size
Click image for original size
Click image for original size

Click image for original size
Click image for original size
Click image for original size
Click image for original size
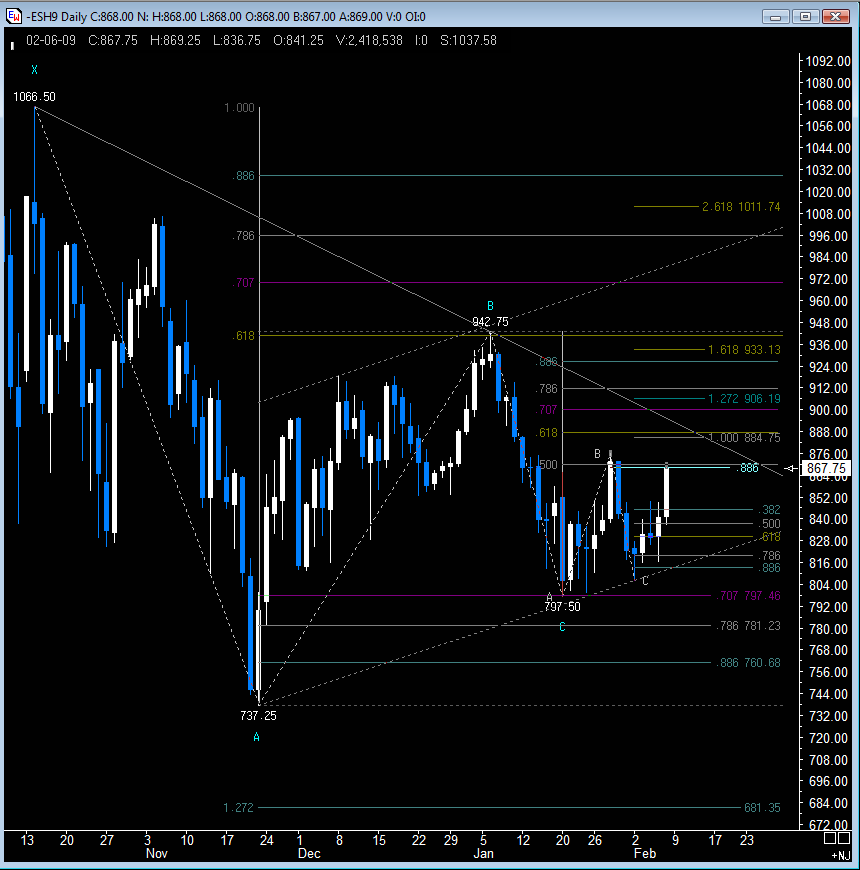
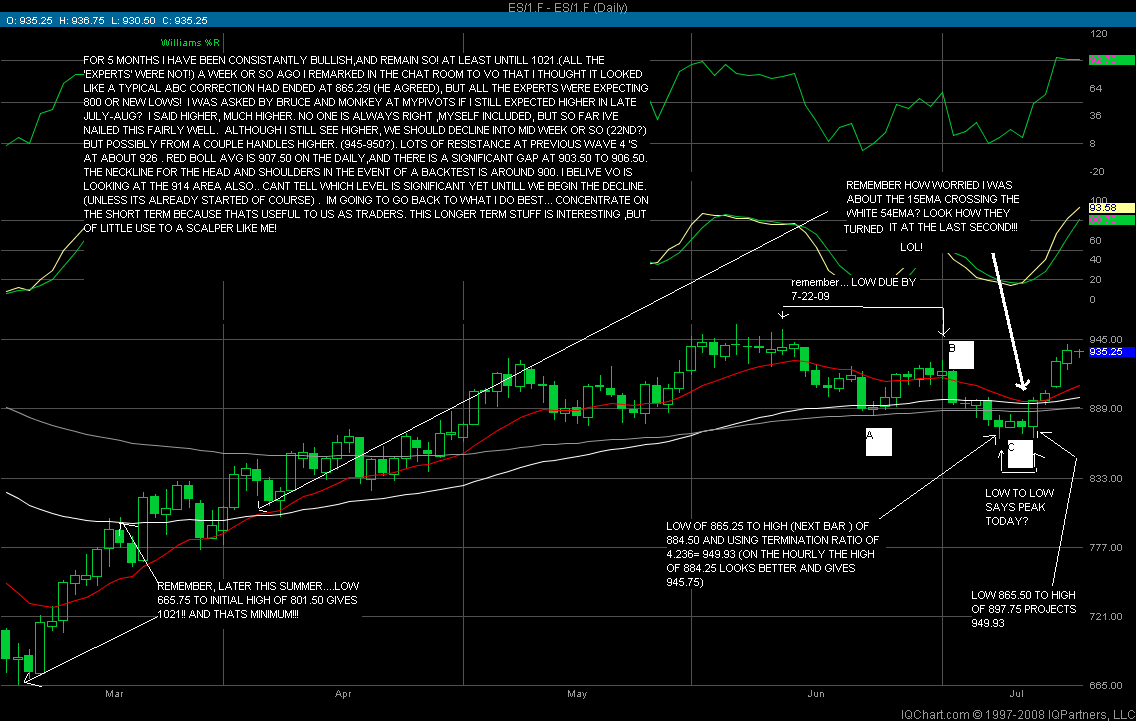
Interesting Triangle on the ES daily chart.
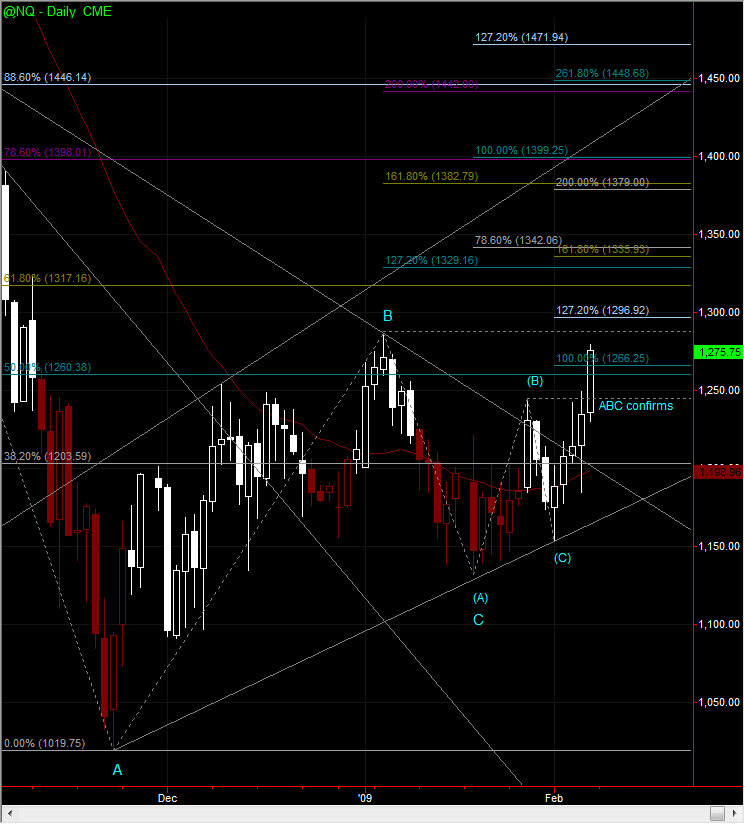
NQ has already broken out of it's corresponding triangle and trendline.
NQ has already broken out of it's corresponding triangle and trendline.
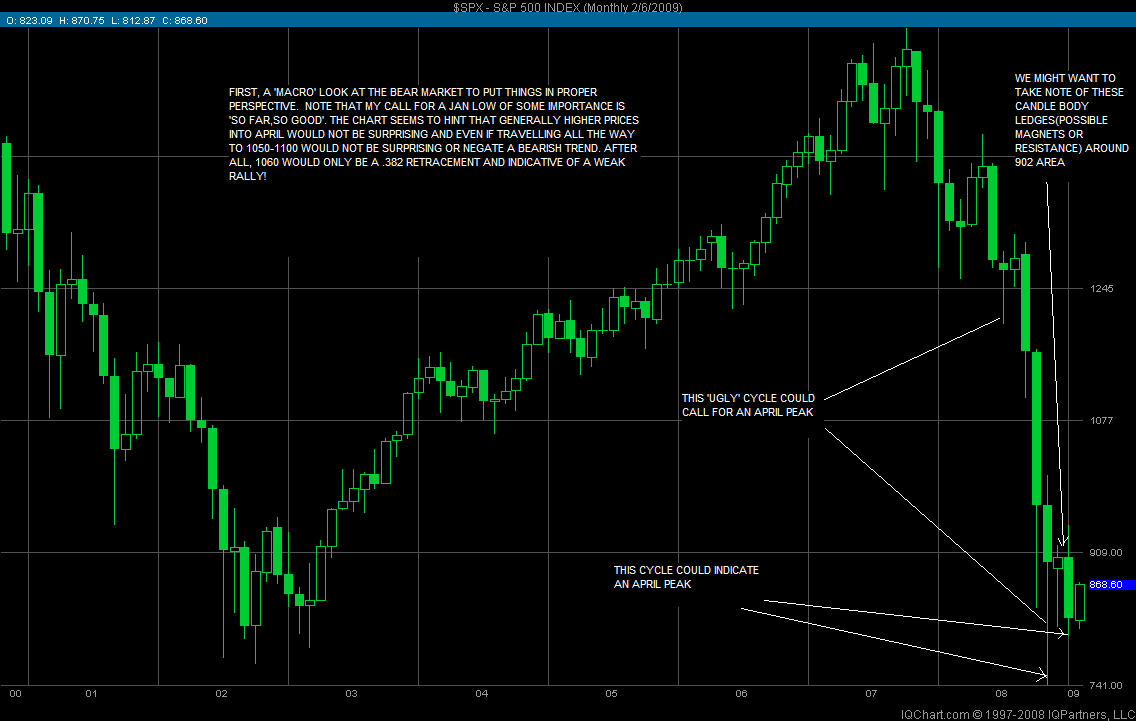
I hesitate to do a longer term scenerio, and risk my 'reputation', since short term scalping is my bread and butter....but it is fun once in a while! read at your own risk, and remember, if it doesnt become very accurate, ill just do what every other analyst on the street does...ignore and deny it! LOL
Click image for original size
Click image for original size
Click image for original size
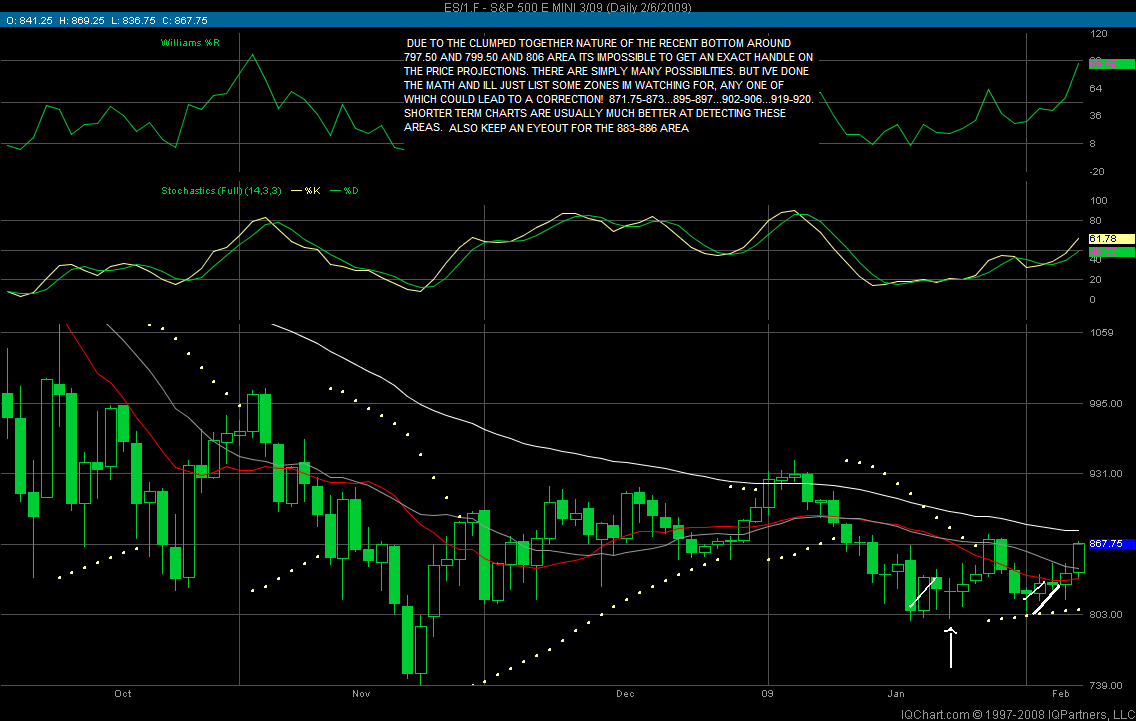
897.00 is one of Bruce's high volume levels from the merged profile. 866 is also, which is where the Friday rally stalled.
Emini Day Trading /
Daily Notes /
Forecast /
Economic Events /
Search /
Terms and Conditions /
Disclaimer /
Books /
Online Books /
Site Map /
Contact /
Privacy Policy /
Links /
About /
Day Trading Forum /
Investment Calculators /
Pivot Point Calculator /
Market Profile Generator /
Fibonacci Calculator /
Mailing List /
Advertise Here /
Articles /
Financial Terms /
Brokers /
Software /
Holidays /
Stock Split Calendar /
Mortgage Calculator /
Donate
Copyright © 2004-2023, MyPivots. All rights reserved.
Copyright © 2004-2023, MyPivots. All rights reserved.