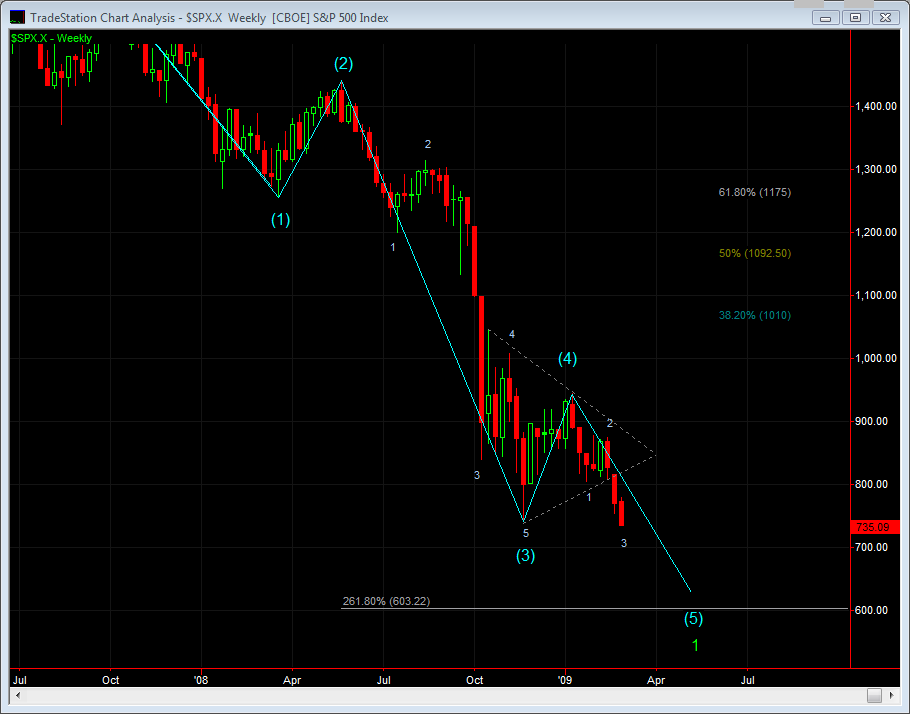
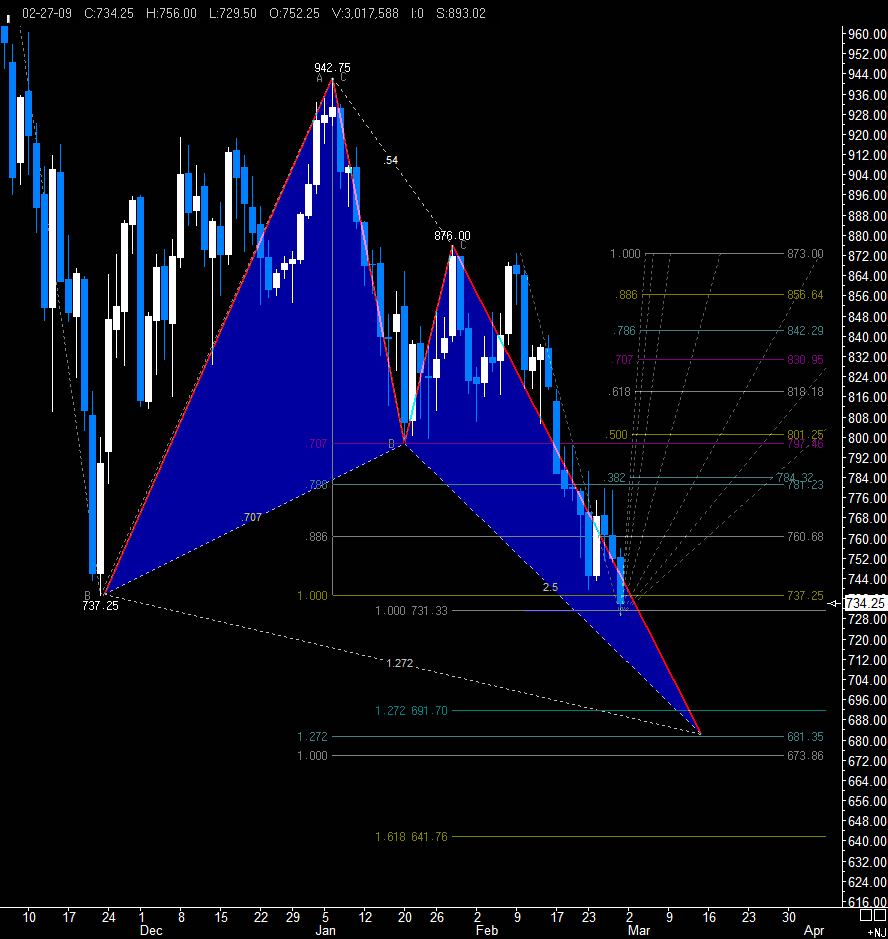
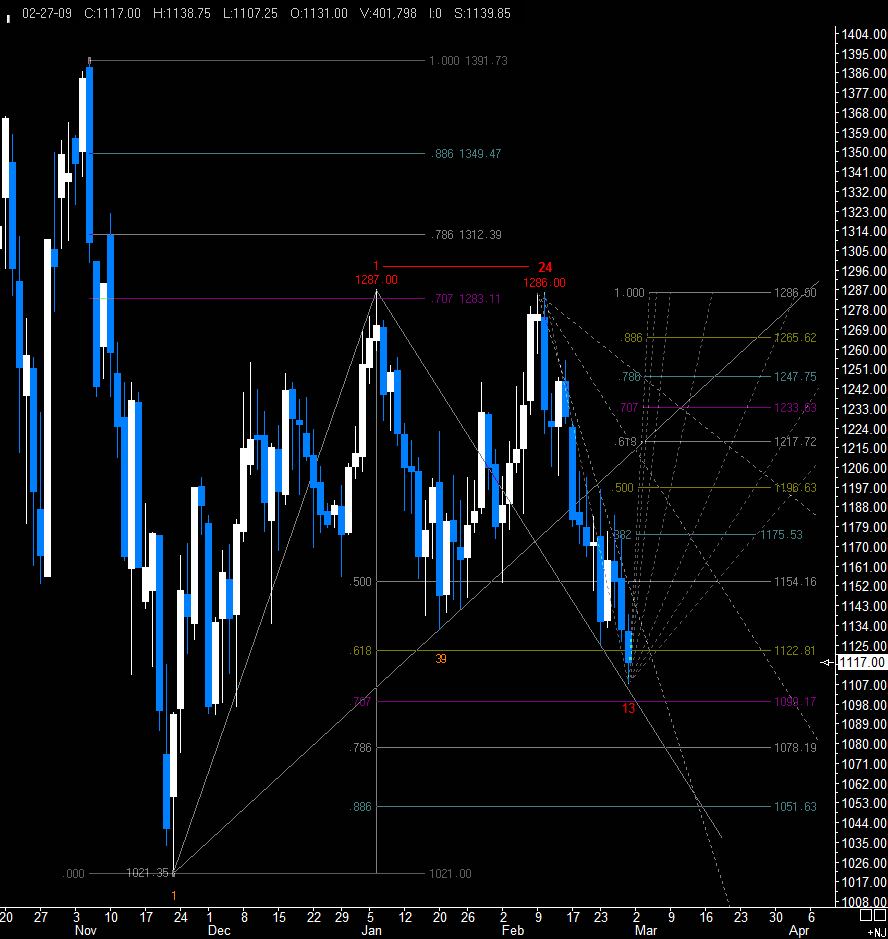
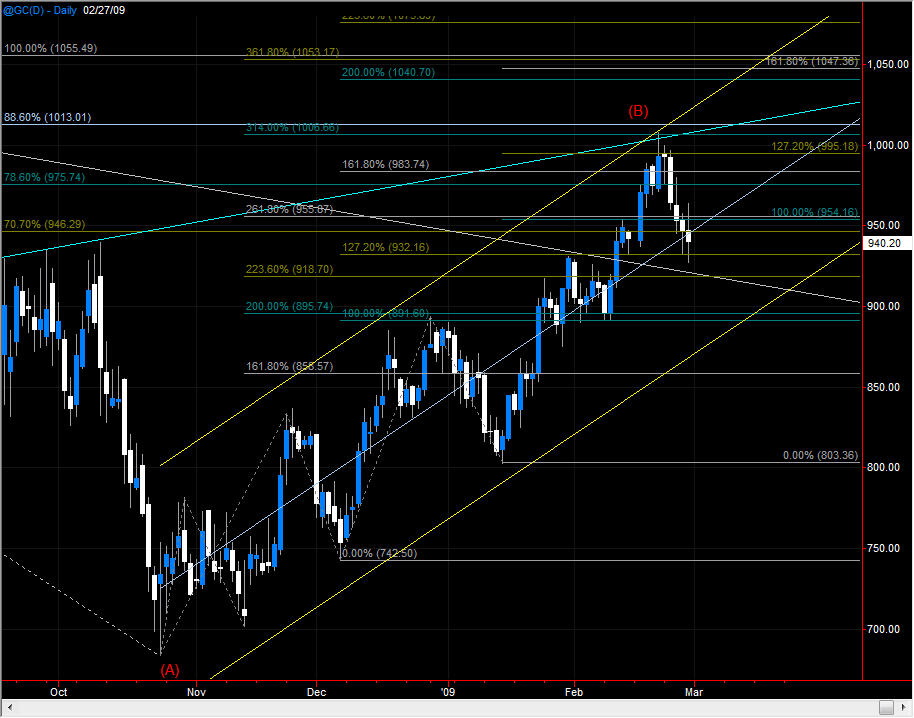
Weekend Chart Summary 2-28-09
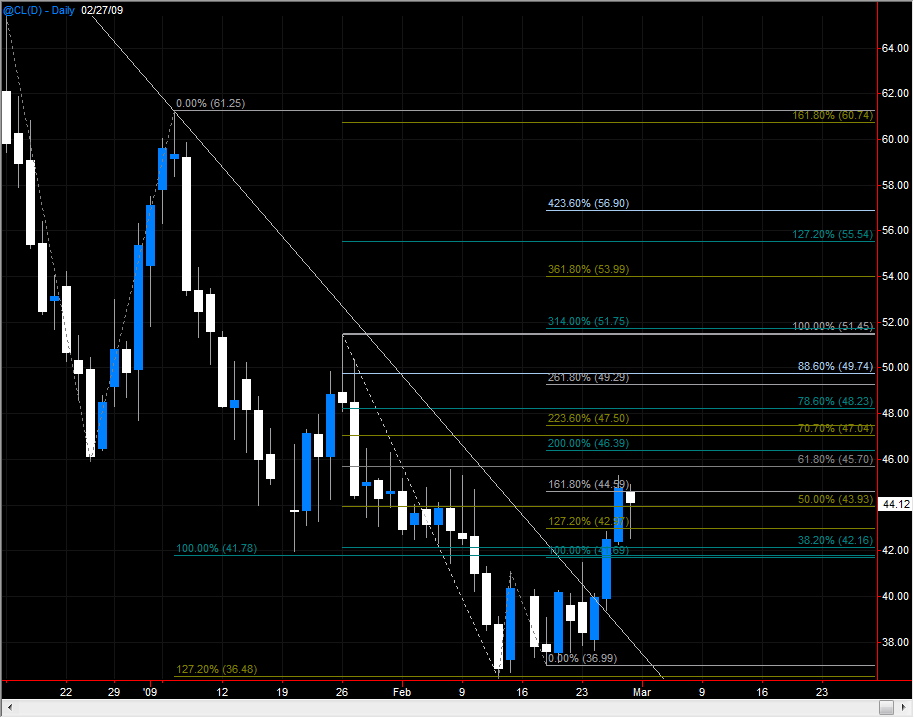
Click image for original size
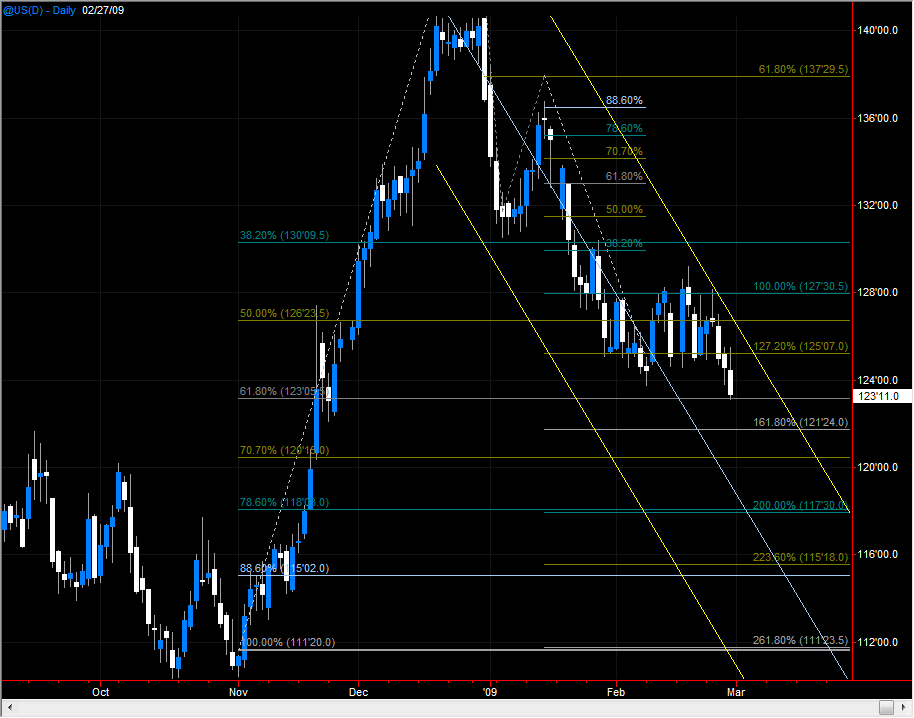
Click image for original size
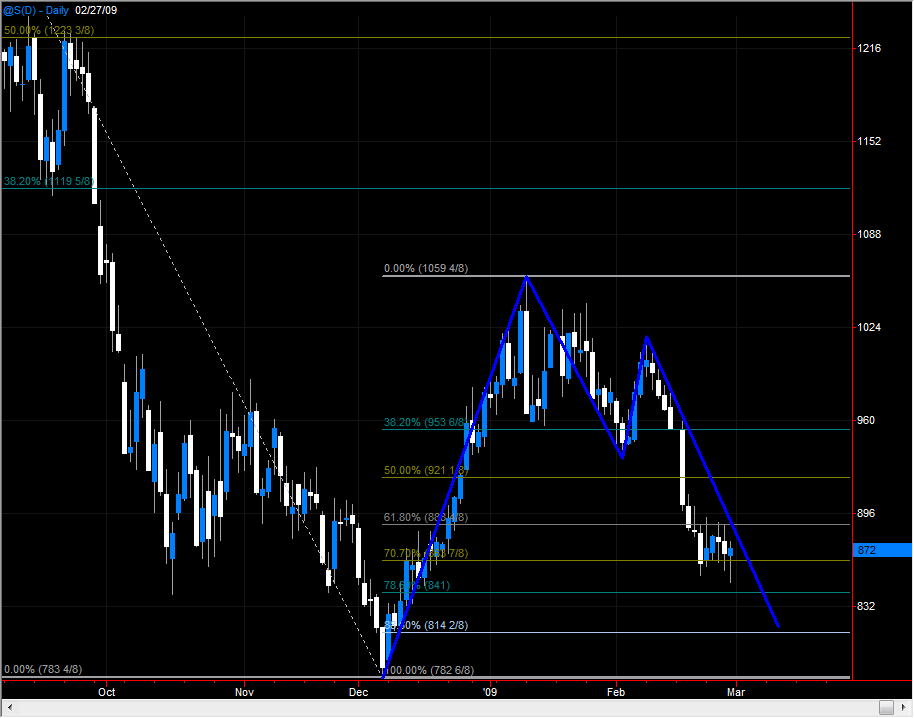
Click image for original size

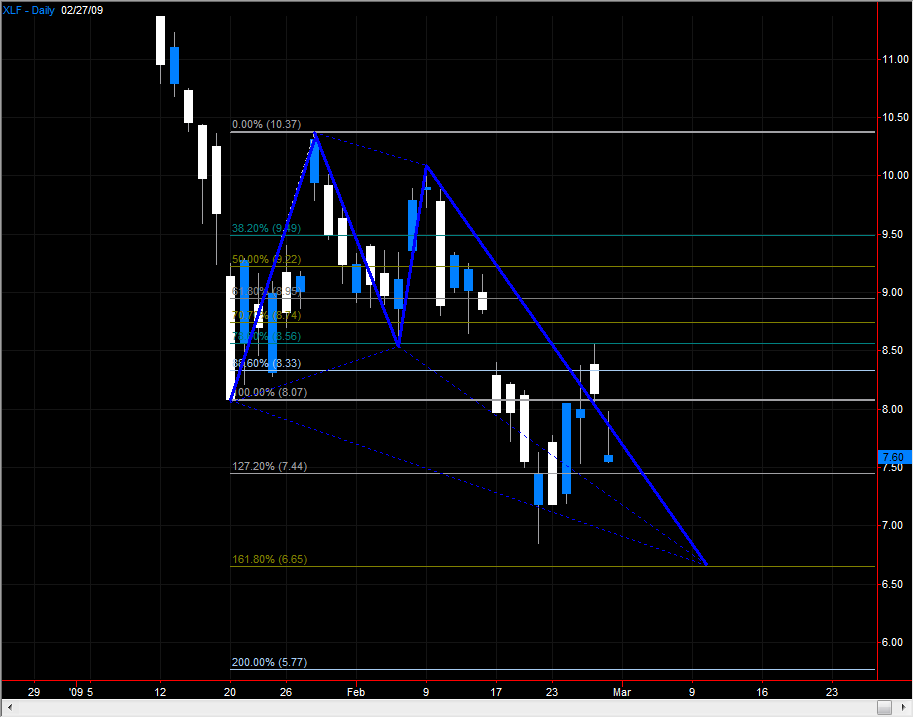
Click image for original size
Click image for original size
Click image for original size
Click image for original size
Click image for original size

Click image for original size
Click image for original size

Click image for original size

Click image for original size
Click image for original size
On a very short term basis ,(globex?) there is also good resistance around the 744-745 pivots and moving averages.
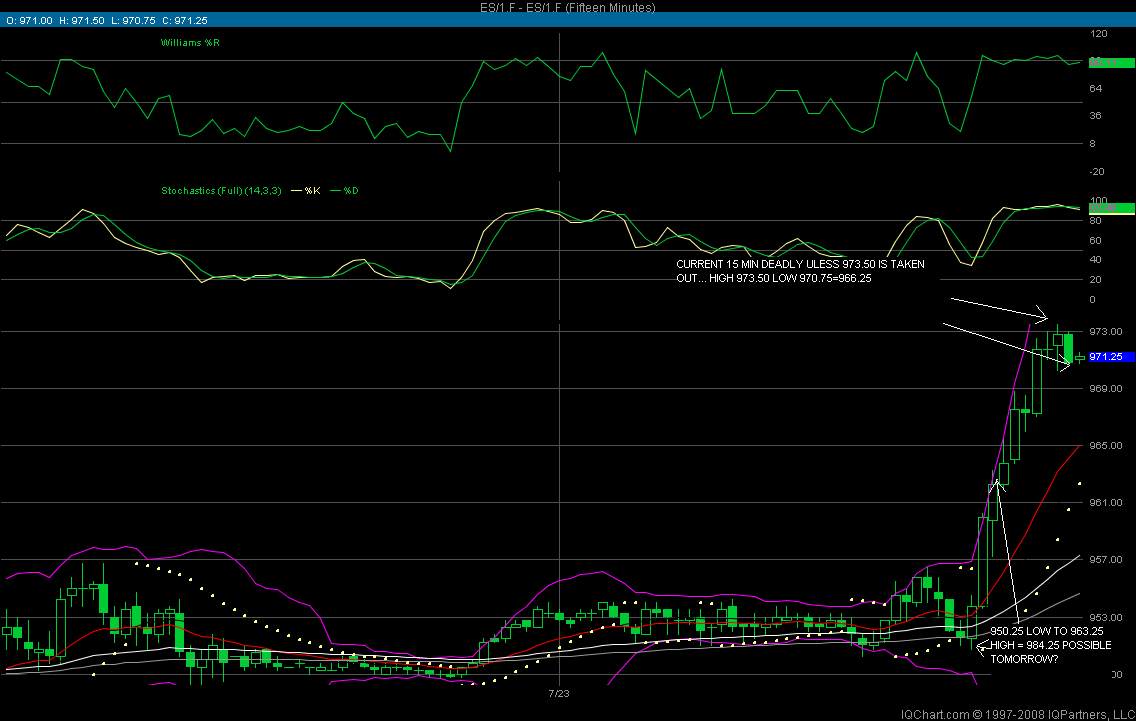
The 7 waves down on the 15 minute started on January 5th?
No,Smithgar, much shorter term it started at 750.75 on 2-27 as seen on the above chart
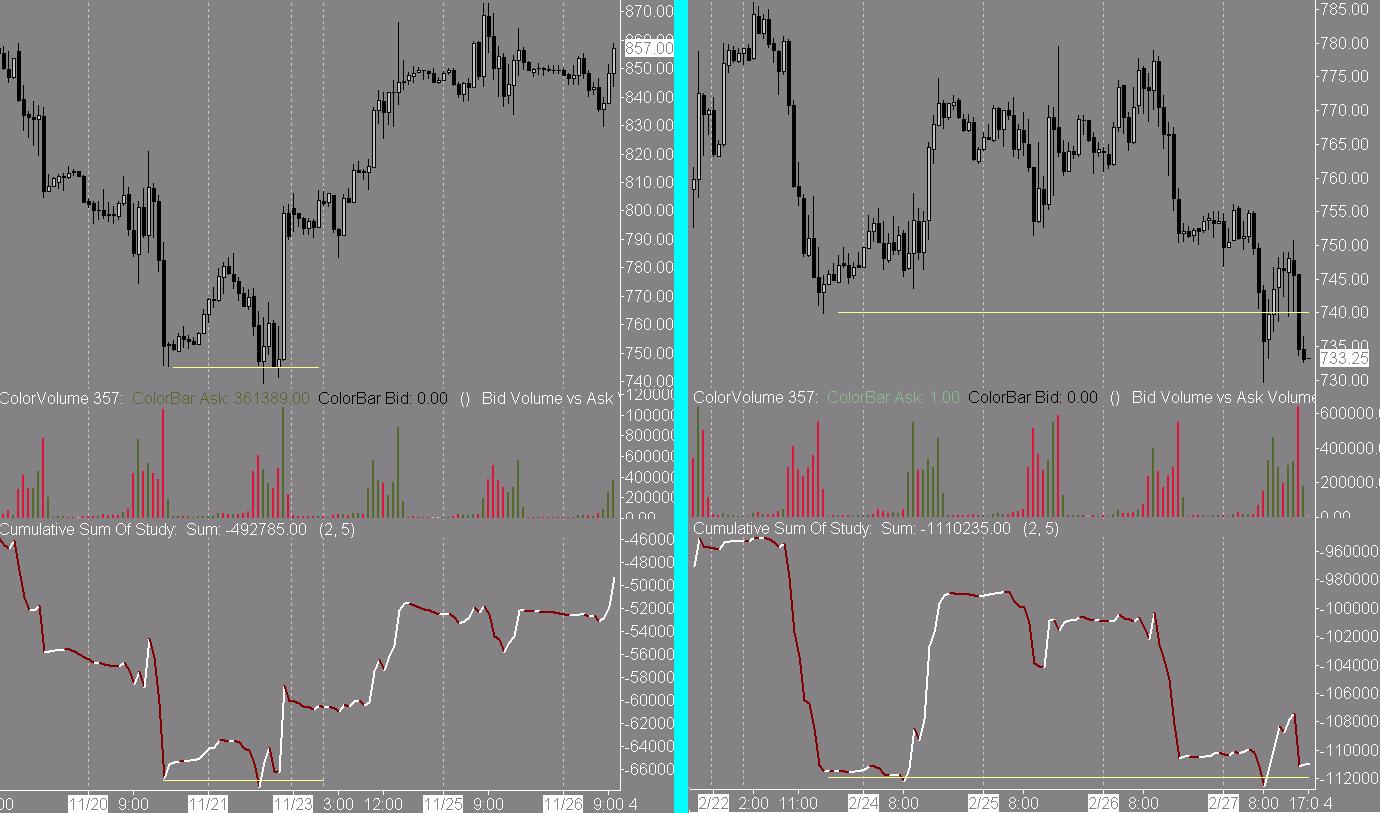
Was comparing recent cumulative volume action in the ES to 21NOV08. I thought the similarities were valid of a post.
Click image for original size
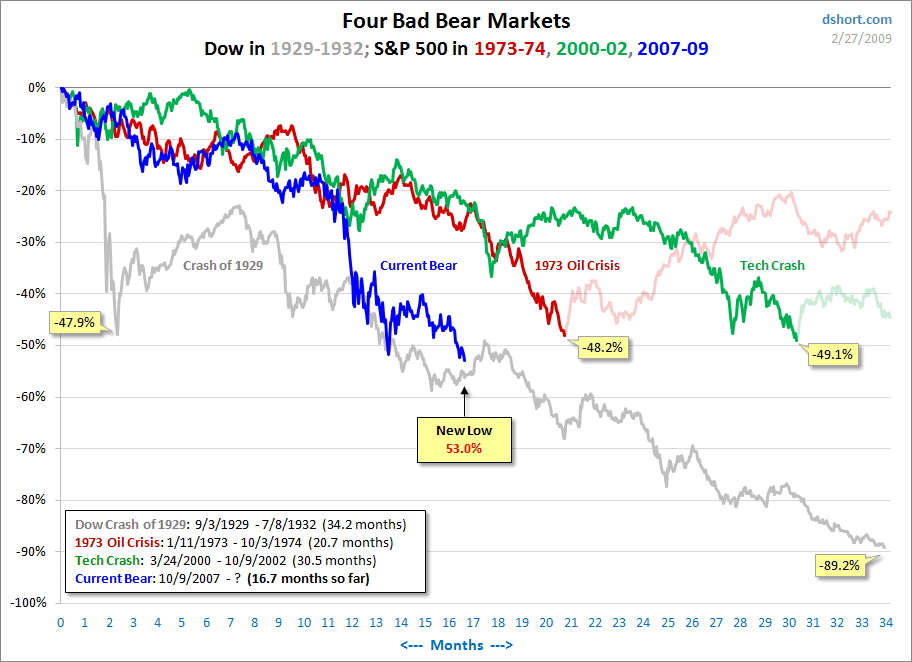
To put things in perspective in terms of time check this out . We're likely only a little over halfway through this 'nightmare'.
Click image for original size
Emini Day Trading /
Daily Notes /
Forecast /
Economic Events /
Search /
Terms and Conditions /
Disclaimer /
Books /
Online Books /
Site Map /
Contact /
Privacy Policy /
Links /
About /
Day Trading Forum /
Investment Calculators /
Pivot Point Calculator /
Market Profile Generator /
Fibonacci Calculator /
Mailing List /
Advertise Here /
Articles /
Financial Terms /
Brokers /
Software /
Holidays /
Stock Split Calendar /
Mortgage Calculator /
Donate
Copyright © 2004-2023, MyPivots. All rights reserved.
Copyright © 2004-2023, MyPivots. All rights reserved.