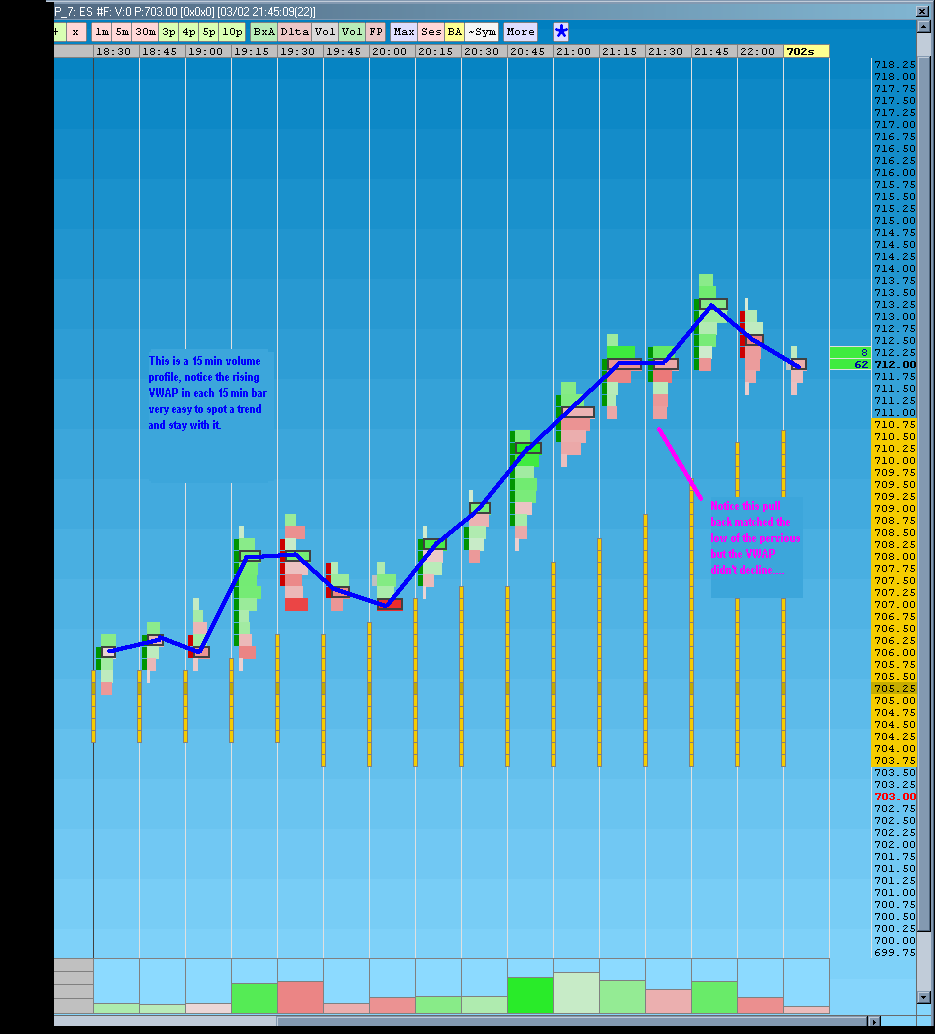
intra-day V.W.A.P. (VWAP)
Click image for original size
for these current Vwap lines I'm only using yesterdays but I also use the high volume numbers and other "clasic" stuff(likes singles) from MP so I can see what happens if we get a "hit" on a developing band as the day unfolds at the same time.........I'm still new to the Vwap stuff so this is a work in progress...but as an example.....yesterday afternoon we doubled the IB range up into the third standard deviation band...so that became a potential better short to take........I missed that trade though and only mention it here.
A current after market experiment I'm trying is to see if we take trades only in the direction of the current days developing Vwap to try and target a plus or minus 8- 10 point number, previous days low,high or overnight area......or other signififcant point.....basically I want to see how well the Vwap trends or if it whipsaws in early trade too much to provide any use to us
A current after market experiment I'm trying is to see if we take trades only in the direction of the current days developing Vwap to try and target a plus or minus 8- 10 point number, previous days low,high or overnight area......or other signififcant point.....basically I want to see how well the Vwap trends or if it whipsaws in early trade too much to provide any use to us
the vwap bands from Wednesdays trade are these
726.50
721.25
716
711 - VWAP price
705.50
700.50
695.25
so the current overnight low is in third standard deviation down from yesterdays VWAP
726.50
721.25
716
711 - VWAP price
705.50
700.50
695.25
so the current overnight low is in third standard deviation down from yesterdays VWAP
Bruce are you using the peak volume price (PVP) as a gauge with the VWAP;
Longs=
PVP greater than the VWAP
Shorts=
PVP is less than the VWAP
Longs=
PVP greater than the VWAP
Shorts=
PVP is less than the VWAP
Bruce,
I have not decided on using the 24 hour or the regular session. To me it makes since to run them both separate and it also makes since to include them all as one. I think the subject needs to be examined in more depth. I think most start there VWAP and the PVP (peak voulme price) at 9:30 and run it until 4:15....
I have not decided on using the 24 hour or the regular session. To me it makes since to run them both separate and it also makes since to include them all as one. I think the subject needs to be examined in more depth. I think most start there VWAP and the PVP (peak voulme price) at 9:30 and run it until 4:15....
I like point of control (PVP)above Vwap and price below VWAP for shorts and vwap above poc and price above VWAP for longs....
It seems when we get a flip and PVP is under VWAP and price is below VWAP but near or above the PVP..we get a test of the VWAP to the upside...I'll try to make this easier later....
we had a great FLIP of the PVP at 10:03 this morning to 700.25 and then vwap was below PVP...then price got below VWAP and down we went..more later..I just bailed at a minus 10...I LOVE THE VWAP...LOL!!.you may notice how we hit the plus 8 to the tick on the high today......traditional VA low is 704 so folks frontran that.....
i need to get the POC ( on volume)or PVP into my chart window so I can see the FLIPS in PVP...now I'm using the Volume at price function on an IB chart...
Bruce, or anyone...
Do you know of a VWAP and its standard deviation (in the form of lines like on your chart) code for e-signal?
Do you know of a VWAP and its standard deviation (in the form of lines like on your chart) code for e-signal?
I use VWAP in my trading, but I plot them from significant swing highs and lows. A point where sentiment changes, like a swing high is created and then the market turns down and makes lower lows. I, follow the 1st SD's to gauge value of that particular swing. This can be done on many swings (small, medium Big). I also take note in things like rotation from 1st to 2nd SD, which would be repricing of value. This gives me a heads up on countering that particular swing. I will also plot vwaps from failure spots (a place where a low or high fails and new higher/lower value is established) and watch how the market returns to that vwap. To me it is a spot where the guys on the wrong side of the trade may get out at much less of a loss. I am still trying to work out a complete trading plan with all this information, but following the market this way has made much more sense to me.
any chance you could get a few charts to demonstrate this ? That would be a big help to this VWAP newbie!!! Thanks
Bruce
Bruce
I'll try to get a few decent charts up this weekend.
I've just seen that the latest (just released) version of eSignal (10.4) includes VWAP. Have any of you tried it? From eSignal's product news page:
quote:
VWAP Calculator
Under the Tools menu is a new calculator that allows you to get a VWAP value when certain dates / times are specified. You can also apply size filters to include or exclude trades of a given size to estimate where certain trading groups are putting their money into the market. That is to say, you can determine what the VWAP would be if large block trades are removed or if only large block trades are used.
Alternatively, the Weekly VWAP could be generated with this tool, which is a nice way to see what the average price was for the week.
Emini Day Trading /
Daily Notes /
Forecast /
Economic Events /
Search /
Terms and Conditions /
Disclaimer /
Books /
Online Books /
Site Map /
Contact /
Privacy Policy /
Links /
About /
Day Trading Forum /
Investment Calculators /
Pivot Point Calculator /
Market Profile Generator /
Fibonacci Calculator /
Mailing List /
Advertise Here /
Articles /
Financial Terms /
Brokers /
Software /
Holidays /
Stock Split Calendar /
Mortgage Calculator /
Donate
Copyright © 2004-2023, MyPivots. All rights reserved.
Copyright © 2004-2023, MyPivots. All rights reserved.