Charts 3-12-09
Click image for original size
Closing tick +1602
Koolblue, regarding the above chart, so you are combining the first two candles to make the projection to 941.75? And which number did it plunge down to? Thank you.
quote:
Originally posted by smithgar
Koolblue, regarding the above chart, so you are combining the first two candles to make the projection to 941.75? And which number did it plunge down to? Thank you.
I think Koolblue mistyped and the correct projection is 741.75 (actually 741.67). Correct me if i'm wrong of course.
Keep up the good work Kool,
BrightSideOne
Click image for original size
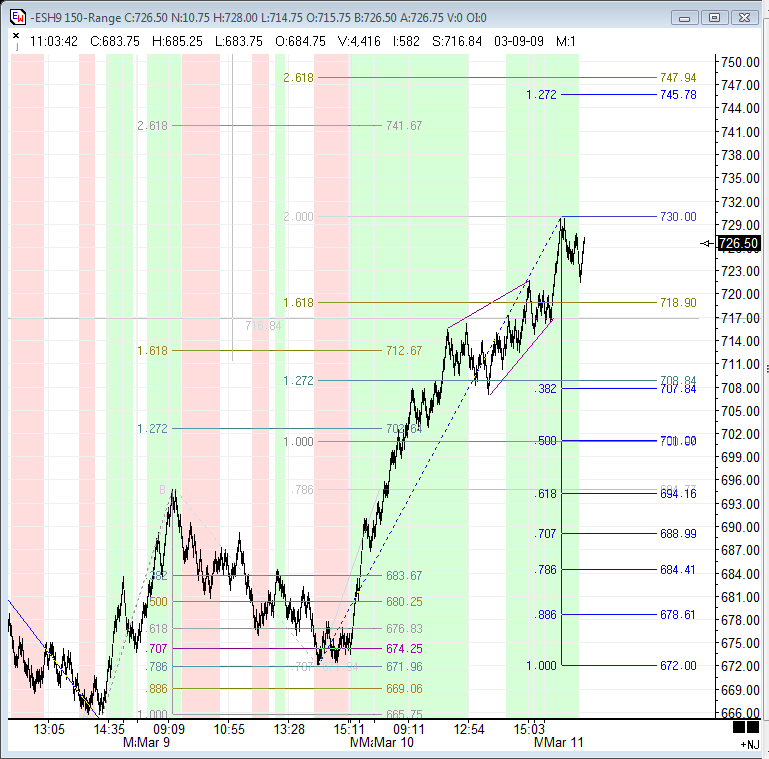
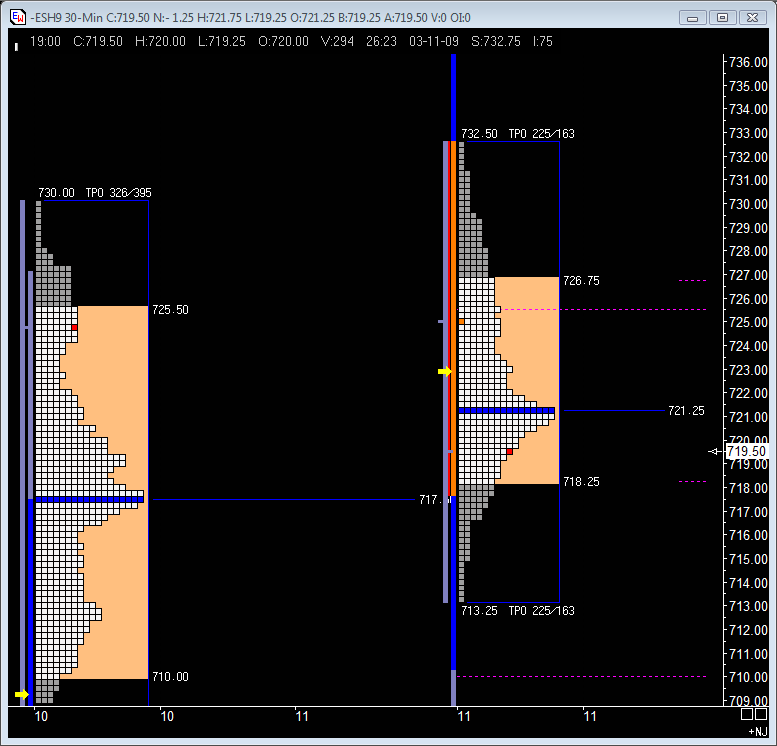
correct guys! the correct number is of course 741.75... strong resistance from 15 min projections 736-738 also....sorry!ON THE DOWNSIDE WATCH FOR 714 AREA and the 694 area
Click image for original size
...
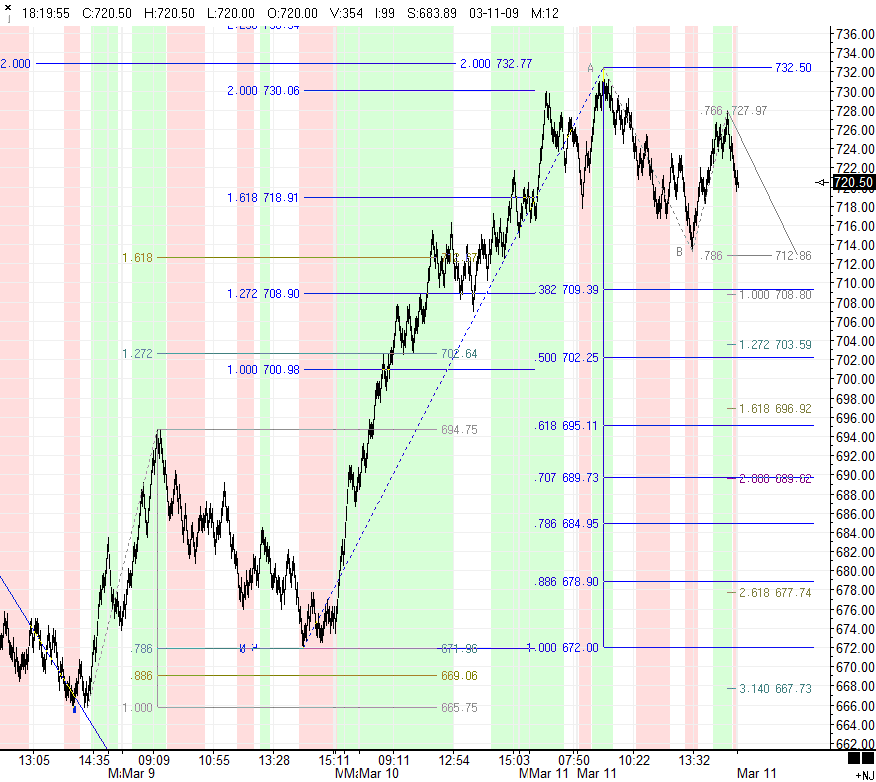
4 days cycle:
- 8 march: h. 15.26 low
- 9 march: 15.17 low
- 10 march: 14.48 low
- 11 march: 14.26??
Perhaps, the high of this 4 days cyles was marked today, at 09.54.
Perhaps, tomorrow down until 13.00-15.00 and end of the cycle and start of a new cycle of 4 days.
Friday up and new high?
- 8 march: h. 15.26 low
- 9 march: 15.17 low
- 10 march: 14.48 low
- 11 march: 14.26??
Perhaps, the high of this 4 days cyles was marked today, at 09.54.
Perhaps, tomorrow down until 13.00-15.00 and end of the cycle and start of a new cycle of 4 days.
Friday up and new high?
Click image for original size
Click image for original size
Click image for original size
Emini Day Trading /
Daily Notes /
Forecast /
Economic Events /
Search /
Terms and Conditions /
Disclaimer /
Books /
Online Books /
Site Map /
Contact /
Privacy Policy /
Links /
About /
Day Trading Forum /
Investment Calculators /
Pivot Point Calculator /
Market Profile Generator /
Fibonacci Calculator /
Mailing List /
Advertise Here /
Articles /
Financial Terms /
Brokers /
Software /
Holidays /
Stock Split Calendar /
Mortgage Calculator /
Donate
Copyright © 2004-2023, MyPivots. All rights reserved.
Copyright © 2004-2023, MyPivots. All rights reserved.