MP Spikes
i'm starting this topic in an effort to gain some insight to and, if possible, shed some light on profile spikes.
now, guy has done some research on spikes, but the spikes i'm referring to are a bit different.
as a starter, we saw spikes in ES, NQ, and ER2 friday. there may have been others (possibly the ZB??), but i focus on these three indices and the DAX so if anyone wants to post ZB, ZN, YM, EC, ZF, ZT, and so forth, please post away
i'll be going over some recent MP charts and coming up with some examples. i'll post them sometime very late tonight or tomorrow.
in the mean time i have attached a ZIP with a DOC showing yesterday's spikes in the ES and NQ.
the first slide shows the entire day.
the second slide shows the VA established intraday pre-spike.
the third slide shows the new VA stemming from the spike (a 'new day' inside the current day).
take care -
omni
Click link to access uploaded file:
9_9_es_and_nq_spikes.zip
9_9_es_and_nq_spikes.zip
I first read about MP spikes in Mind Over Markets. there really isnt'a lot on them, as they are part of the "Special Situations" discussed late in chapter four. basically, the spike is a movement away from an established value area. the spike begins with the time period marking the break-out.
again, i have not heard much about them and even the material in MOM is a bit thin. the thing is, these spikes can be quite impressive. the ES and NQ frequently produce very clear spikes with remarkably accurate post-spike activities. my old fav, the ER2, also has spikes, but often as part of a multi-spike day (i.e. it would not be unusual for the ER2 to establish three intraday VAs from two separate spikes).
as with nearly any other "Situation" nothing is written in stone. in fact, i guess that goes for anything in trading. there are precipitating conditions as well as post-formation conditions that provide traders with better, higher-probability interpretations of the spikes.
another point to consider is the subjectivity of the spike. in looking over the last several weeks of spikes on the ES and NQ, some were plain as day. others were a little more open to interpretation. to some extent, that is only a minor concern, since spikes become especially useful for estimating market direction/conviction for the following session.
okay, enough rambling for now. i'll post some examples tonight, and possibly an annotated document with examples.
until then ...
take care -
omni
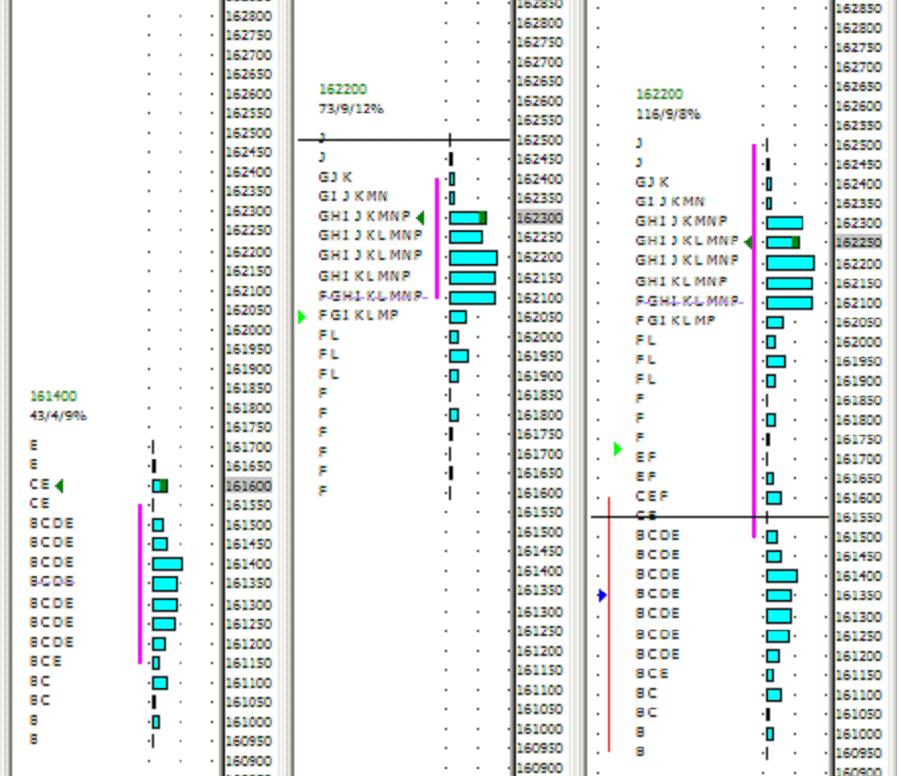
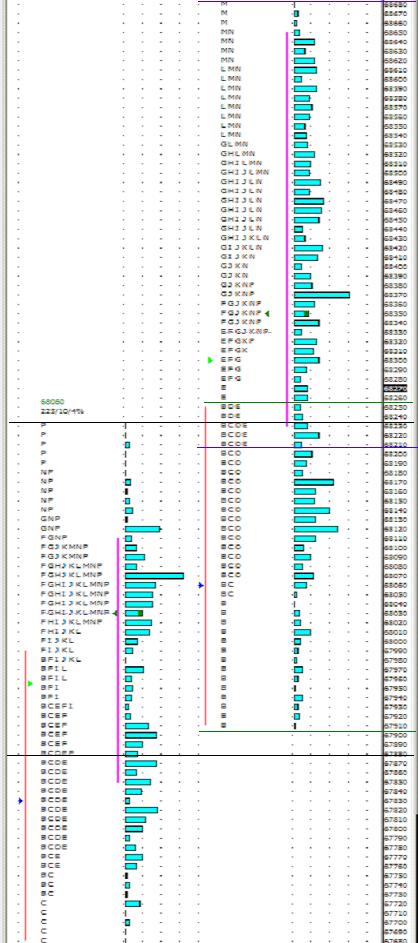
for my first annotated example, i am using the 9th's Buying Spike in the NQ. as the first image indicates, by E-period the NQ had built a normally distributed DVA from about 1609 to 1617. there was a 2-tick upward break of the IB, but by close of E-period price was sitting right at upper IB.
with F-period, the market began moving away from the established DVA and started forming a new DVA, essentiall a new day. the market had rejected the earlier DVA as undervalued and was aiming higher in efforts to shut off buying. the NQ closed 2.5pts down from HOD. there was also a solid ledge at 1620.50 (except for the 3-tick L-period probe) including G/I/K/M/P periods.
when all was said and done, here is how the day looked:
summary: with a supportive ledge forming at 1620, the 'new day' building between 1616 and 1625, close near top, and new short/intermediate term highs, i will look for the NQ to trade higher on the 12th (barring any news related events). per typical spike behavior, there is a good probability the 12th will:
1. trade within a 9pt range (est by the 'new day' of 1616-1625)
2. form a normal day
3. not trade below 1616
the third point is the most critical. if it trades outside the range, but above the spike bottom, the spike is still in effect. day type is not a tremendous consideration either. but, if it trades below the spike bottom by more than a couple of ticks, the market landscape has changed. if the market is strong enough, it may never even come close to testing the 1616 area and form a trend day and reach new, higher highs.
we'll see what the 12th holds for the NQ ...
take care -
omni
with F-period, the market began moving away from the established DVA and started forming a new DVA, essentiall a new day. the market had rejected the earlier DVA as undervalued and was aiming higher in efforts to shut off buying. the NQ closed 2.5pts down from HOD. there was also a solid ledge at 1620.50 (except for the 3-tick L-period probe) including G/I/K/M/P periods.
when all was said and done, here is how the day looked:
Click image for original size
summary: with a supportive ledge forming at 1620, the 'new day' building between 1616 and 1625, close near top, and new short/intermediate term highs, i will look for the NQ to trade higher on the 12th (barring any news related events). per typical spike behavior, there is a good probability the 12th will:
1. trade within a 9pt range (est by the 'new day' of 1616-1625)
2. form a normal day
3. not trade below 1616
the third point is the most critical. if it trades outside the range, but above the spike bottom, the spike is still in effect. day type is not a tremendous consideration either. but, if it trades below the spike bottom by more than a couple of ticks, the market landscape has changed. if the market is strong enough, it may never even come close to testing the 1616 area and form a trend day and reach new, higher highs.
we'll see what the 12th holds for the NQ ...
take care -
omni
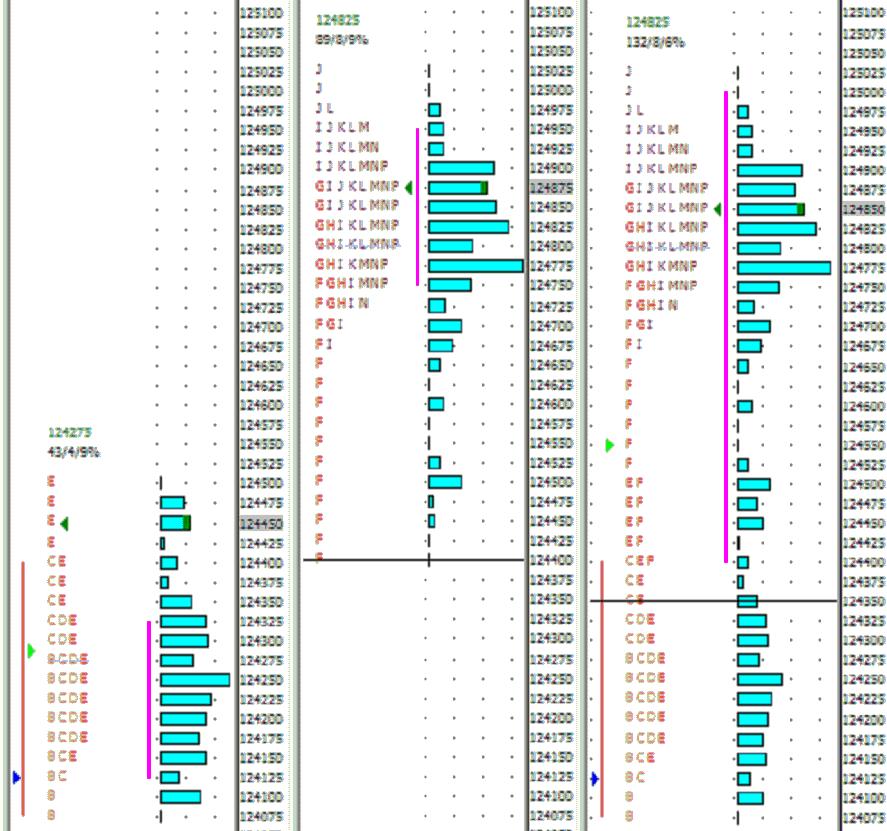
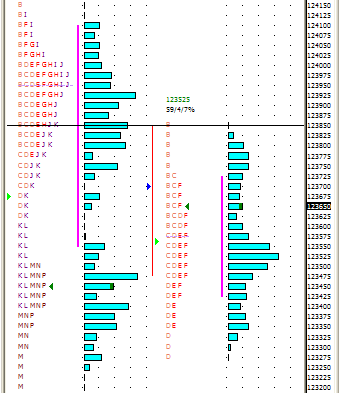
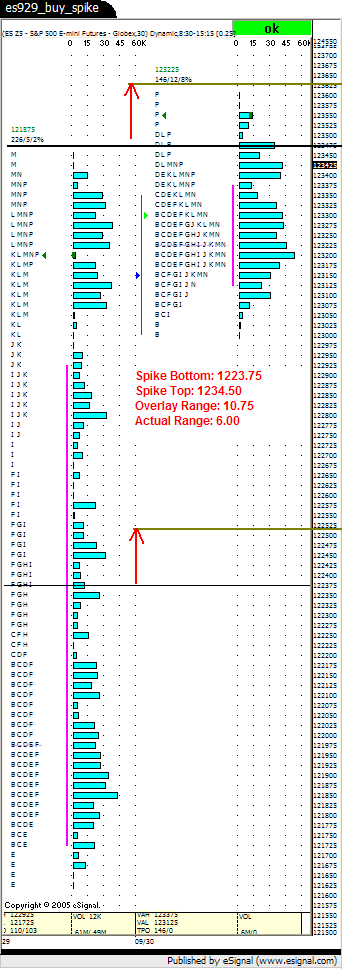
next, i will look at the Buying Spike formed in the ES on September 9th. it has a lot of similarities to the NQ, but still deserves its own attention.
again, the market was forming a normally distrubted DVA and broke through the upper IB in E-period. in the case of the ES, it was a 4-tick break and the E-period closed 2-ticks above the IB high. this, to me, is a decent example of the potential subjectivity of spike analysis. i consider the spike to have started with F-period, but some may view E-period as the time period when the market broke away from established value. my main justification for chosing F-period as a starting point is that, though it did overlap a few ticks of E-period, it never went below the IB high.
anyway, so the spike began and established new value between 1247.50 and 1249.50, closing very near the middle of this 'new day'. so, for the 12th we would expect:
1. price to stay above the spike bottom (1244.00)
2. the range to be about 6.25pts
3. possible normal day
4. higher highs
unlike the NQ, the ES did not establish an major ledge. it did thin out a lot after 1247, but it thinned past 1249.75 also. in fact, there is a wide difference between volume between 1247.75-1249.00 and 1249.25-1250.25.
as with the NQ, we will see what the 12th brings ...
take care -
omni
Click image for original size
well, today the post-spike activity was pretty typical. i'll start with the ES.
the ES had a 6.25-pt buying spike range on friday and today it only had a 4pt range. the range was also within the buying spike, so that conformed to expectations. the shape was essentially a normal distribution, so again, today conformed to probable expectations.
it basically continued building value in the same region as it did on friday (1246-1250).
it is also interesting to note that it did fill in the F-period singles created on friday (though it didn't completely fill in the spike tail).
oh, and trading the ES today was excruciating. with a 4pt range, i'm sure that isn't too hard to imagine.
here's the chart of Friday and today:
Click image for original size
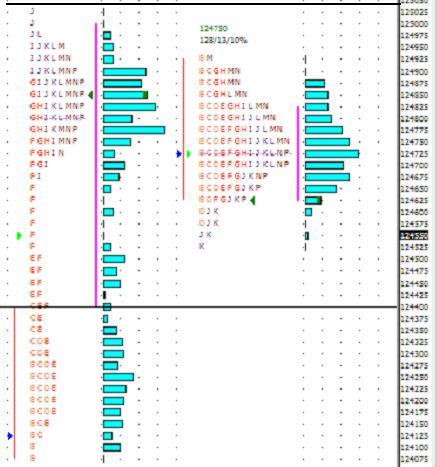
on to the NQ ...
it too mostly conformed to the probable expectations for today:
1. stayed within or above spike bottom
2. formed normal distribution
3. stayed at or above major ledge (okay, it 1-ticked it)
4. stayed close to 'new day' range from friday's spike
it traded in a 12pt range whereas friday saw a 9pt range. and, for about 90% of the day it was within a 10pt range.
here's the chart. the black horizontal lines simply mark the 'new day' range on friday and the green lines overlay that range from the LOD:
Click image for original size
finally, we have the ER2. the wild one
it too had a buying spike on friday. at first i was a little surprised that it seemed to be severely breaking away from the 'new day' range established in Friday's spike. well, it was. what i didn't realize was that it was happening via a new buying spike.
how did it compare to the ES and NQ as far as spike behavior?
1. never traded below spike bottom
2. stayed within spike range (at least through today's 'old day' it did)
3. slowly built upon value area from friday (680.70 - 682.30)
it didn't form a normal distribution because it was too busy forming a buying spike starting in E-period. it was then so bold as to use friday's HOD as support!!! it produced a 4.8pt 'new day' range for tomorrow.
here's the chart (black lines = 9/9 NDR (new day range); green lines = NDR overlay; blue lines = 9/12 NDR):
take care -
omni
it too had a buying spike on friday. at first i was a little surprised that it seemed to be severely breaking away from the 'new day' range established in Friday's spike. well, it was. what i didn't realize was that it was happening via a new buying spike.
how did it compare to the ES and NQ as far as spike behavior?
1. never traded below spike bottom
2. stayed within spike range (at least through today's 'old day' it did)
3. slowly built upon value area from friday (680.70 - 682.30)
it didn't form a normal distribution because it was too busy forming a buying spike starting in E-period. it was then so bold as to use friday's HOD as support!!! it produced a 4.8pt 'new day' range for tomorrow.
here's the chart (black lines = 9/9 NDR (new day range); green lines = NDR overlay; blue lines = 9/12 NDR):
Click image for original size
take care -
omni
okay, i meant to post this stuff last night, but actually fell asleep early. so here it is, too late for making early plays today ... my bad.
we had spikes in the ES, NQ, and ER2. good probability we will see some continuation today.
what about the solo spike on the ER2 the other day? well, i don't know the rate of incidence, but my guess is there is a lower rate of probability of spike continuation when fewer instruments concur. that's what happened with the ER2 the other day - the spike failed. next day it was opposite direction and the spike was never touched. that's a pretty common method for the market to reject a spike.
anyway, i'll start with the ES from yesterday. the Selling Spike started in K-period at 1238.50 and extended down to 1232.00. that means we look for a range of about 6.5pts today and trades to stay under 1239 (preferrably under 1238.75). we also look for a probable normal distribution. so far, everything is holding up as it should.
we'll see what the rest of the day holds.
take care -
omni
we had spikes in the ES, NQ, and ER2. good probability we will see some continuation today.
what about the solo spike on the ER2 the other day? well, i don't know the rate of incidence, but my guess is there is a lower rate of probability of spike continuation when fewer instruments concur. that's what happened with the ER2 the other day - the spike failed. next day it was opposite direction and the spike was never touched. that's a pretty common method for the market to reject a spike.
anyway, i'll start with the ES from yesterday. the Selling Spike started in K-period at 1238.50 and extended down to 1232.00. that means we look for a range of about 6.5pts today and trades to stay under 1239 (preferrably under 1238.75). we also look for a probable normal distribution. so far, everything is holding up as it should.
Click image for original size
we'll see what the rest of the day holds.
take care -
omni
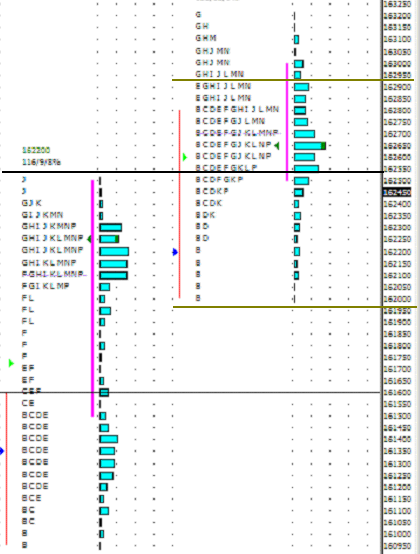
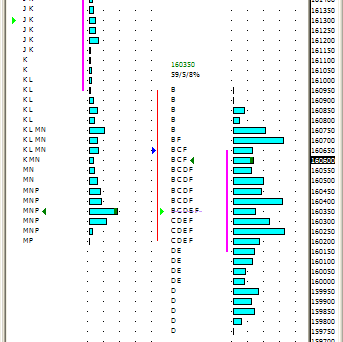
on to the NQ ...
it too had a nice Selling Spike, but its origin is a bit subjective. i would say it started no later than K-period (1614.00) and as early as J-period (1618.00). either way, it extended down to 1602.00, so we are looking for a range between 12 and 16 points. again, we also look for normal distribution curve and nothing above the spike top.
as with the ES, the NQ is giving us that so far. it has about a 12pt range with pretty decent curve, down RE, and made a beautiful short off VAL. very nice.
again, we will have to wait for the rest of the day to unfold for final results.
take care -
omni
it too had a nice Selling Spike, but its origin is a bit subjective. i would say it started no later than K-period (1614.00) and as early as J-period (1618.00). either way, it extended down to 1602.00, so we are looking for a range between 12 and 16 points. again, we also look for normal distribution curve and nothing above the spike top.
as with the ES, the NQ is giving us that so far. it has about a 12pt range with pretty decent curve, down RE, and made a beautiful short off VAL. very nice.
Click image for original size
again, we will have to wait for the rest of the day to unfold for final results.
take care -
omni
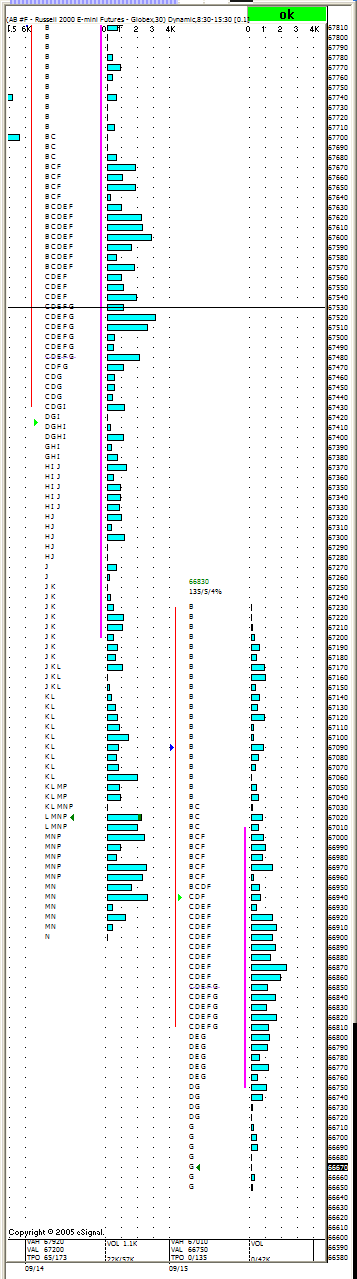
finally, let's look at the Wild One ... the ER2. it may not beat the DAX or QM for volatility, but this thing can still swiftly plant a size 38-EEE steel-toe boot right sqawr in the jewels. anyway, enough of that ...
the ER2 also had a nice Selling Spike, though i think its origins are especially subjective. i will say i don't think it started any later than J-period and as early as G-period. go Wild One! so we are looking a Spike top between 675.30 and 673.70. i'm going with G-period. that's when things really started breaking away from established value. since the spike extended down to 669.00, we are looking at a range of about 6.3pts today. so far the range has been 5.2points. it has never traded higher than the top of K-period from yesterday, also made a very lovely selling opportunity at VAL, has been forming more of a "b" shape than a bell-shape curve, but the hump in the "b" has been forming nicely. right now it is hovering around the LOD - woops, it just broke through. so did the ES and will the NQ follow? (dramatic pause) so far, no, it stayed 1-tick away from LOD. i'm not hanging around to watch it either. anyway, the ER2 has been a cooperative Spike participant today.
as with the rest of the crew, we will wait for 4:15 est to assess the entire day.
take care -
omni
BTW: possible buying opp around 666.5 (near LOD, near daily S1, near low end of Spike range overlay, thin volume).
the ER2 also had a nice Selling Spike, though i think its origins are especially subjective. i will say i don't think it started any later than J-period and as early as G-period. go Wild One! so we are looking a Spike top between 675.30 and 673.70. i'm going with G-period. that's when things really started breaking away from established value. since the spike extended down to 669.00, we are looking at a range of about 6.3pts today. so far the range has been 5.2points. it has never traded higher than the top of K-period from yesterday, also made a very lovely selling opportunity at VAL, has been forming more of a "b" shape than a bell-shape curve, but the hump in the "b" has been forming nicely. right now it is hovering around the LOD - woops, it just broke through. so did the ES and will the NQ follow? (dramatic pause) so far, no, it stayed 1-tick away from LOD. i'm not hanging around to watch it either. anyway, the ER2 has been a cooperative Spike participant today.
Click image for original size
as with the rest of the crew, we will wait for 4:15 est to assess the entire day.
take care -
omni
BTW: possible buying opp around 666.5 (near LOD, near daily S1, near low end of Spike range overlay, thin volume).
i know, i know, the day isn't over yet, but come on ... tell me the day hasn't shaped up ideally for a post-Selling Spike day? shoot, by this point the rest of the day is of marginal interest to anyone who benefitted from the dictates of the spike. they should have been able to call it a day a long time ago
more later ...
take care -
omni
more later ...
take care -
omni
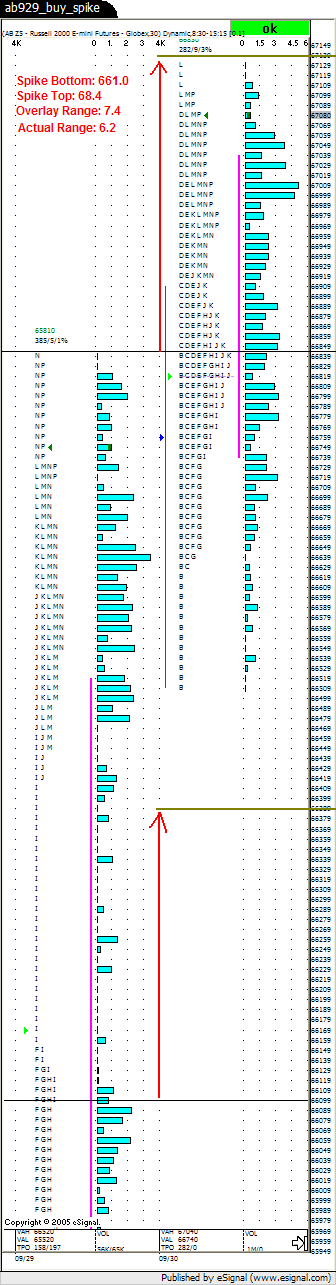
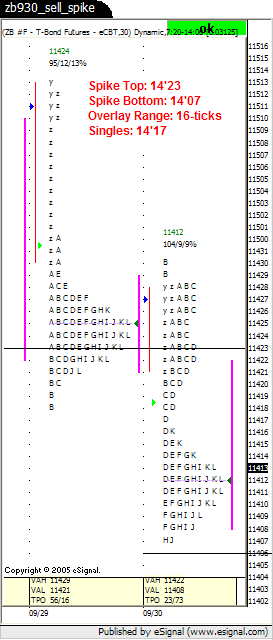
there have been other spikes since the 16th, but i haven't posted them. i didn't post the 29th's spike either, but i am posting the 29th's Spike and the post-Spike session (the 30th).
notes are on the charts:
ER2
ES
NQ
there was also a spike in the ZB on the 30th:
ZB
have a great weekend.
take care
omni
notes are on the charts:
Click image for original size
Click image for original size
Click image for original size

there was also a spike in the ZB on the 30th:
Click image for original size
have a great weekend.
take care
omni
Emini Day Trading /
Daily Notes /
Forecast /
Economic Events /
Search /
Terms and Conditions /
Disclaimer /
Books /
Online Books /
Site Map /
Contact /
Privacy Policy /
Links /
About /
Day Trading Forum /
Investment Calculators /
Pivot Point Calculator /
Market Profile Generator /
Fibonacci Calculator /
Mailing List /
Advertise Here /
Articles /
Financial Terms /
Brokers /
Software /
Holidays /
Stock Split Calendar /
Mortgage Calculator /
Donate
Copyright © 2004-2023, MyPivots. All rights reserved.
Copyright © 2004-2023, MyPivots. All rights reserved.