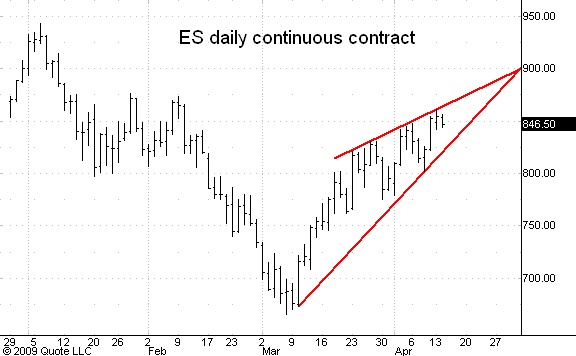
ES rising wedge
Here is something I'm keeping a close eye on, especially as this rises right into some of my key areas. Please refer to my April '09 commentary on my website, which shows the overhead areas I am watching. There is also a minor area that was hit at today's (4/13/09) high.
This is a rising wedge, and is very bearish, and quite ominous looking. You can draw the lines a bit different if you want, perhaps not starting at the low, but starting at the 3/30 or 4/1 low, but the pattern is the same. Having this pattern form right into key areas makes it all the more ominous. Just something I am watching, as always, price action is key.
Chart created with QCharts, courtesy eSignal
Click image for original size
This is a rising wedge, and is very bearish, and quite ominous looking. You can draw the lines a bit different if you want, perhaps not starting at the low, but starting at the 3/30 or 4/1 low, but the pattern is the same. Having this pattern form right into key areas makes it all the more ominous. Just something I am watching, as always, price action is key.
Chart created with QCharts, courtesy eSignal
quote:
Originally posted by jimkane
...On the way there I'm watching around 857, which is a better test of that lower line from below, and I have some other lines and Fibs and such in there...
Well, it sure did like that 857 area I mentioned (858.75 was the high, far closer than my tolerance levels for a setup as large as that one was), testing that line from below. I'm surprised it acted 'technically', given the bullish sentiment is so thick you could cut it with a knife. On the other hand they did, what, the third day recently where they gapped it down and ran it right up, so maybe that got some of that buying fever quelled for the day.
One curious thing is this is three days they 'one ticked' the high and dumped it. It's also curious how they shot for the LOD and one ticked that before the RTH close. Now we'll see if this is the start of something, or just another one day wonder until the 'manipulation ramper robot drones' run it back up again. No matter what they do, this is some of the best intraday trend trading I have ever seen.
Here's an update on the chart:
Click image for original size
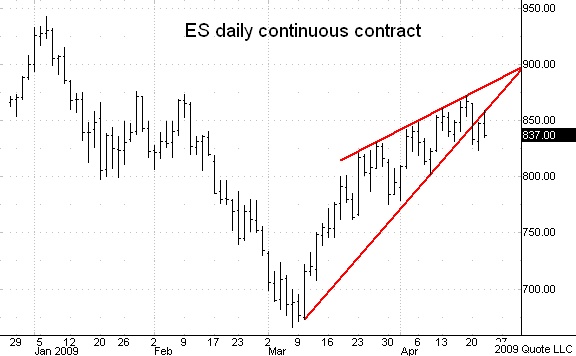
Chart created on QCharts, courtesy eSignal
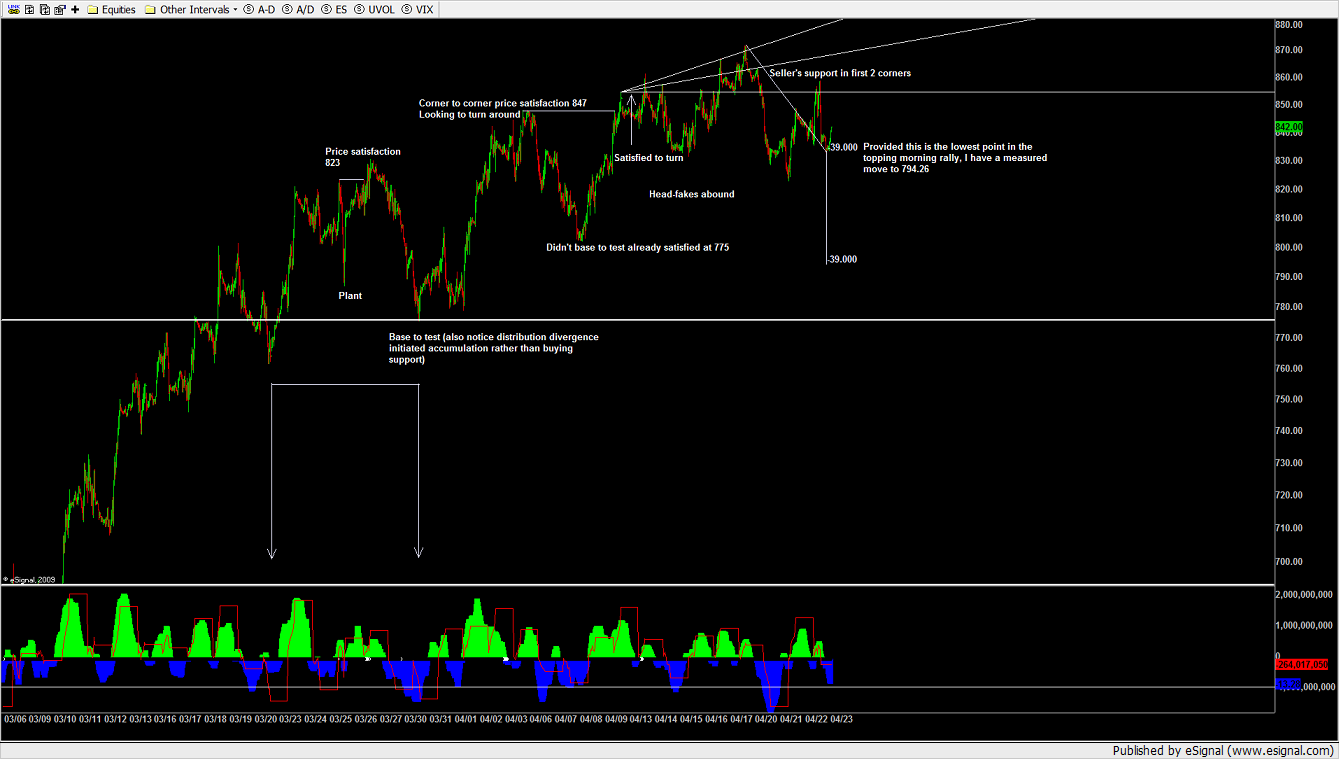
A fellow price action reader. Jolly good. I came up with that same angle a different way.
The corner they're satisfied at an want to test will end the run.
The nano quant army will find a way to make a double bottom and one-tick it though. Watch.
The corner they're satisfied at an want to test will end the run.
The nano quant army will find a way to make a double bottom and one-tick it though. Watch.
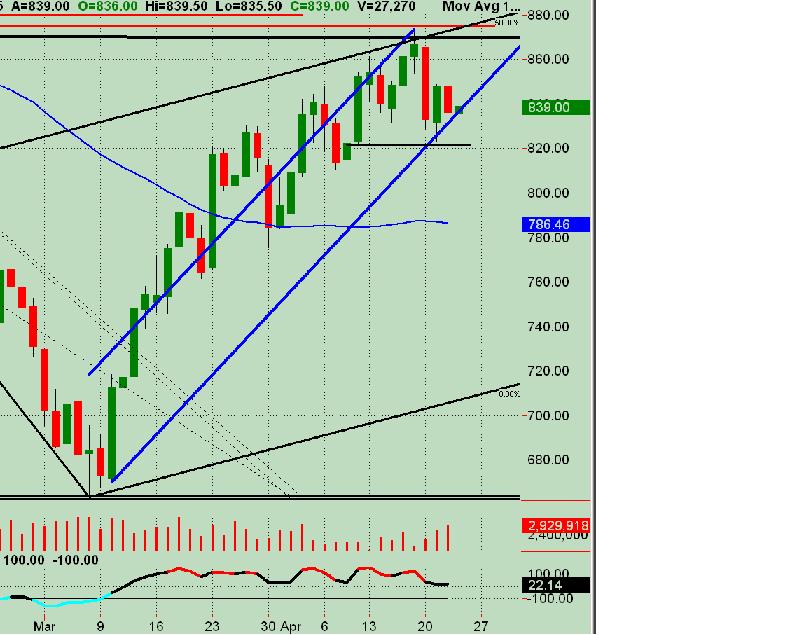
Trend lines / Trend channels for the daily ES chart and ES 30m chart
(including overnight data)
Daily chart's upsloping, lower thick blue line functioned as
support ... a breakdown could break down towards the prior swing low
at 823 ... or "hold" with the market moving back up to retest today's
(Wednesday) high perhaps.
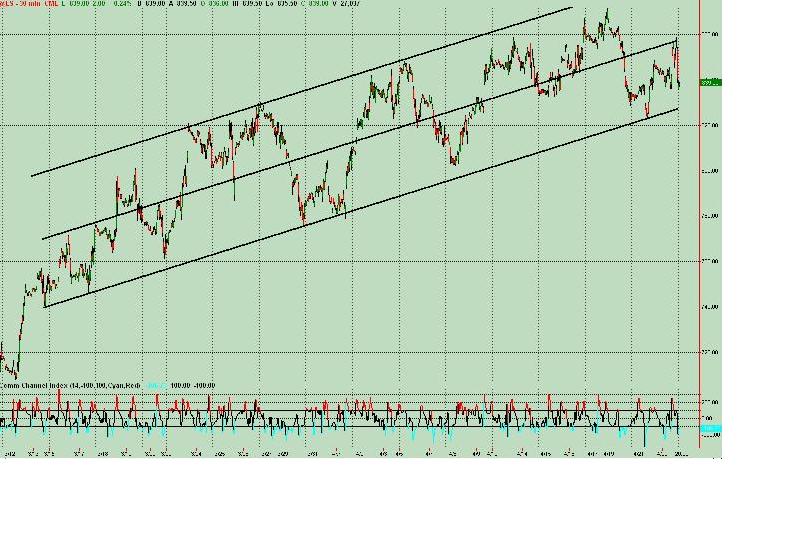
The 30m chart of ES includes overnight trading inside uptrend channel.
Offers potential room for a drop down into the 830 area early in the
day session (if not tested or taken out overnight)... also have a
daily S1 in same price area.
Just tossing out some additional analysis along with the "rising
wedge" breakdown and retest appearance on the charts.
(including overnight data)
Daily chart's upsloping, lower thick blue line functioned as
support ... a breakdown could break down towards the prior swing low
at 823 ... or "hold" with the market moving back up to retest today's
(Wednesday) high perhaps.
The 30m chart of ES includes overnight trading inside uptrend channel.
Offers potential room for a drop down into the 830 area early in the
day session (if not tested or taken out overnight)... also have a
daily S1 in same price area.
Just tossing out some additional analysis along with the "rising
wedge" breakdown and retest appearance on the charts.
Click image for original size
Nice charts.
Click image for original size
quote:I've been discussing that area for over a month now. RTH high today 885.75 and down 19 points so far without letup. Not bad. Now it sits right on a key area where it is starting to bounce a little. What it does here tells me a lot about whether it wants the next higher area, or that is it. This area it came off of is the most significant area I have of all of them, so it would be 'technically beautiful' to me if that was it. But there is a lot to be said, too, about the timing factors for May/June, so I'm keeping a close eye on what it does from here.
Originally posted by jimkane
My next key area above the high is around 883-885...
Okay, here's some interesting thoughts. Well, they are interesting to me. Recall when I started this thread, it was just about the time that every last person on the planet saw and was talking about the ending diagonal. I thought it might start down, then go up and over, because it was just too obvious, too talked about everywhere. I can't recall a pattern or setup more discussed than that one. Perhaps until now. We all see it, we are all hearing about it, the obvious triangle we may now be in, on the daily chart once again. The most obvious interpretation would be we need to go back down to the lower line, and then it completes in textbook fashion, and explodes up. We all saw this Friday intraday. But, this is so obvious.
Another viewpoint, equally obvious, is that this is just an undefined coil, and it is about to break out above the upper boundary. What I am wondering is, will this do the same thing as last time with that ending diagonal? This is destined to break to the upside, and I haven't seen a single person who feels otherwise. Be honest, you know you are calling for the upside, every last reader of this post. So, to follow the last pattern (fake in the expected direction, then reverse and blow the pattern out), it headfakes up, as expected, and then heads down, confounding everyone.
And let me stray for a minute. Here's the next obvious part. Where is this destined for, in everyone's viewpoint? Well, first is 942. I posted that long ago on my website (in the first week of April), and so has everyone else. I can't recall an area as discussed as this. I have a slew of numbers all hitting dead on there. And right above that, the obvious .382 at 962, also talked about all over. And if that doesn't stop it? Again, go back to my commentary on the website from that April post forward, the 1012-1021 area (1018 is the 'meaty' spot of the area). Hmmm, sound familiar? Yep, everyone is also pointing that one out. All over. Every place I look. Everyone is calling for the same exact spots.
Isn't that just too obvious? Doesn't it bother all you out there that we are all calling for the same exact things as everyone else? We are watching the same obvious patterns, and all calling for the same exact spots? I for one am deeply troubled by this. Yes, sometimes the market does exactly what we expect, and sometimes that's even when every last person on the earth is calling for it. Heck, that 666 was called months in advance by an analyst, and still it went right there and turned on a dime, on an exact time factor many were watching. Sometimes it does happen. It would be cool if this played out that way, right to 942, how about a small checkback, up to 962, another small checkback, up to 1012-1021, then get crushed. But talk about scripted. Anyway, I just wanted to point this all out. Maybe it will get some responses and differing viewpoints, who knows.
No comments, eh? Straight over that top line, going for option #2, the undefined coil, right to that 942 area. Up and over the 200-day. Anyone think it will roll over now, or correct? Maybe the surprise for everyone is that it doesn't even slow down here, or at 962, or at 1012-1021... I thought my post would get a lot of responses. Okay, I see you're all going to stick with the checkback at 942, right? Don't worry, I can do a one man show in here :-)
sorry J, I usually don't frequent the public forum much these days so I wasn't aware of your post here.
I don't have any comments since I agree with pretty much everything u said. I just wanted to point out the intermarket factors that are lining up and it is hard to ignore them and to fade those areas seem tough.So I'm respecting the primary bias of the setups and will see if that can hold.I'm expecting rollover stabs and I'm watching the volume patterns to get early clues. But as it stands right now, the trend is obviously up.That might change but it needs to either crush it with a shock event or many many stabbing games for this to actually turn back down.I don't know what will unfold but I expect anything at anytime. The main thing is to have a good trade management plan to keep u in the game until things turn favorably. That's my approach. The flow dictates my posture.No top No bottom, just entries and exits.
regards
T
The really curious thing here is what I see, sentiment-wise, on the news. Today I was listening to the two main TV channels we all watch, and also reading a mainstream news website. Every last person discussed how far the market will go. Not one bear in here. Many partial bulls going full bull, every newsletter writer, every analyst, every fund manager, it was 100% bull, the only discussion (between the ones I saw on TV and the articles I skimmed, which must have been at least thirty total) was how far it was going to go. Now, normally I'd say once we reach that point, a sharp reversal is imminent. This is akin to the everyone is on the same side of the boat analogy.
But, alas, in this era of monstrous government manipulation of the markets, I came up with a new, revised analogy. Everyone is now on the same side of the boat, but the boat is being held up on that side by the strong arms of the government, in all their infinite wisdom. But the party is starting to get loud, and the guests are eating and eating like piggies. They are getting fatter and fatter, and they are having so much fun that they are shaking the boat a lot, with little worry. As they get fatter and fatter and wilder and wilder, the time will come when that boat just can't stay upright any longer. I've just never seen so many people, even good traders I respect, all say the same thing at the same time, and even the very experienced traders have little worry about this. The one thing I will note is, if we get any kind of market shock event this boat will capsize so fast, and drown everyone so fast, it will be something to see.
But, alas, in this era of monstrous government manipulation of the markets, I came up with a new, revised analogy. Everyone is now on the same side of the boat, but the boat is being held up on that side by the strong arms of the government, in all their infinite wisdom. But the party is starting to get loud, and the guests are eating and eating like piggies. They are getting fatter and fatter, and they are having so much fun that they are shaking the boat a lot, with little worry. As they get fatter and fatter and wilder and wilder, the time will come when that boat just can't stay upright any longer. I've just never seen so many people, even good traders I respect, all say the same thing at the same time, and even the very experienced traders have little worry about this. The one thing I will note is, if we get any kind of market shock event this boat will capsize so fast, and drown everyone so fast, it will be something to see.
just my 2.5 cents :)
Emini Day Trading /
Daily Notes /
Forecast /
Economic Events /
Search /
Terms and Conditions /
Disclaimer /
Books /
Online Books /
Site Map /
Contact /
Privacy Policy /
Links /
About /
Day Trading Forum /
Investment Calculators /
Pivot Point Calculator /
Market Profile Generator /
Fibonacci Calculator /
Mailing List /
Advertise Here /
Articles /
Financial Terms /
Brokers /
Software /
Holidays /
Stock Split Calendar /
Mortgage Calculator /
Donate
Copyright © 2004-2023, MyPivots. All rights reserved.
Copyright © 2004-2023, MyPivots. All rights reserved.