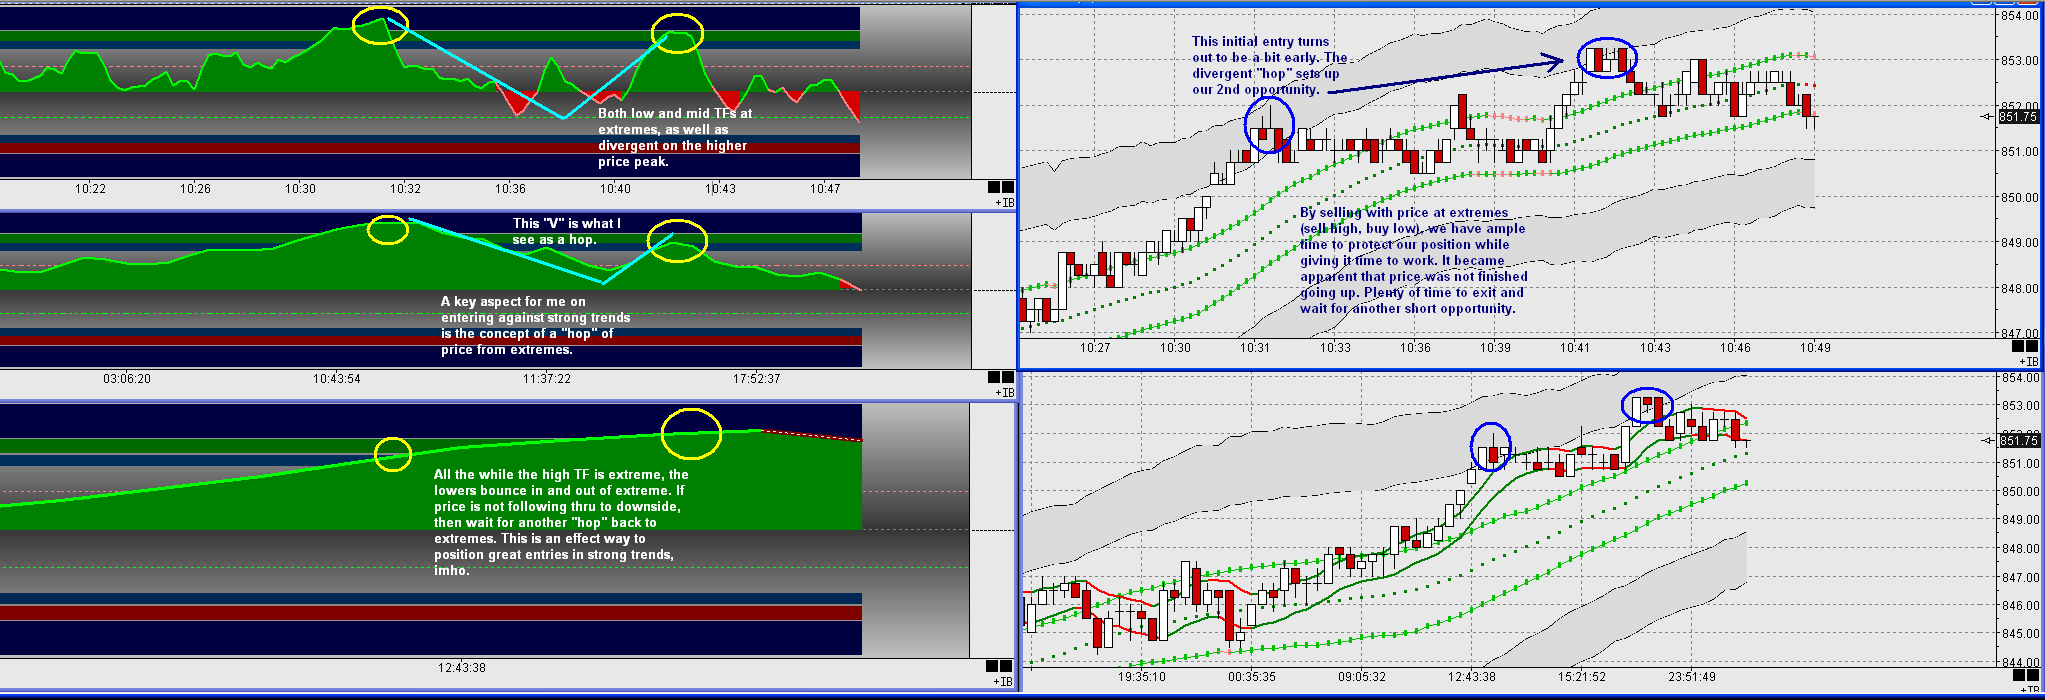
Trading turns in a strong trend
Our peak just now is a great example of what I look for and how I approach trading turns in strong trends. What little insights I have were derived the "hard way", believe me, lol. Its not for everyone. I hope the attached chart can provide some useful insights into an effective method of trading against strong trends (or what some call picking tops/bottoms). It certainly can be done, but takes practice and some useful tools. I am showing you "a" way, certainly not "the" way. It works for me, perhaps it can benefit you to some degree.
Click image for original size
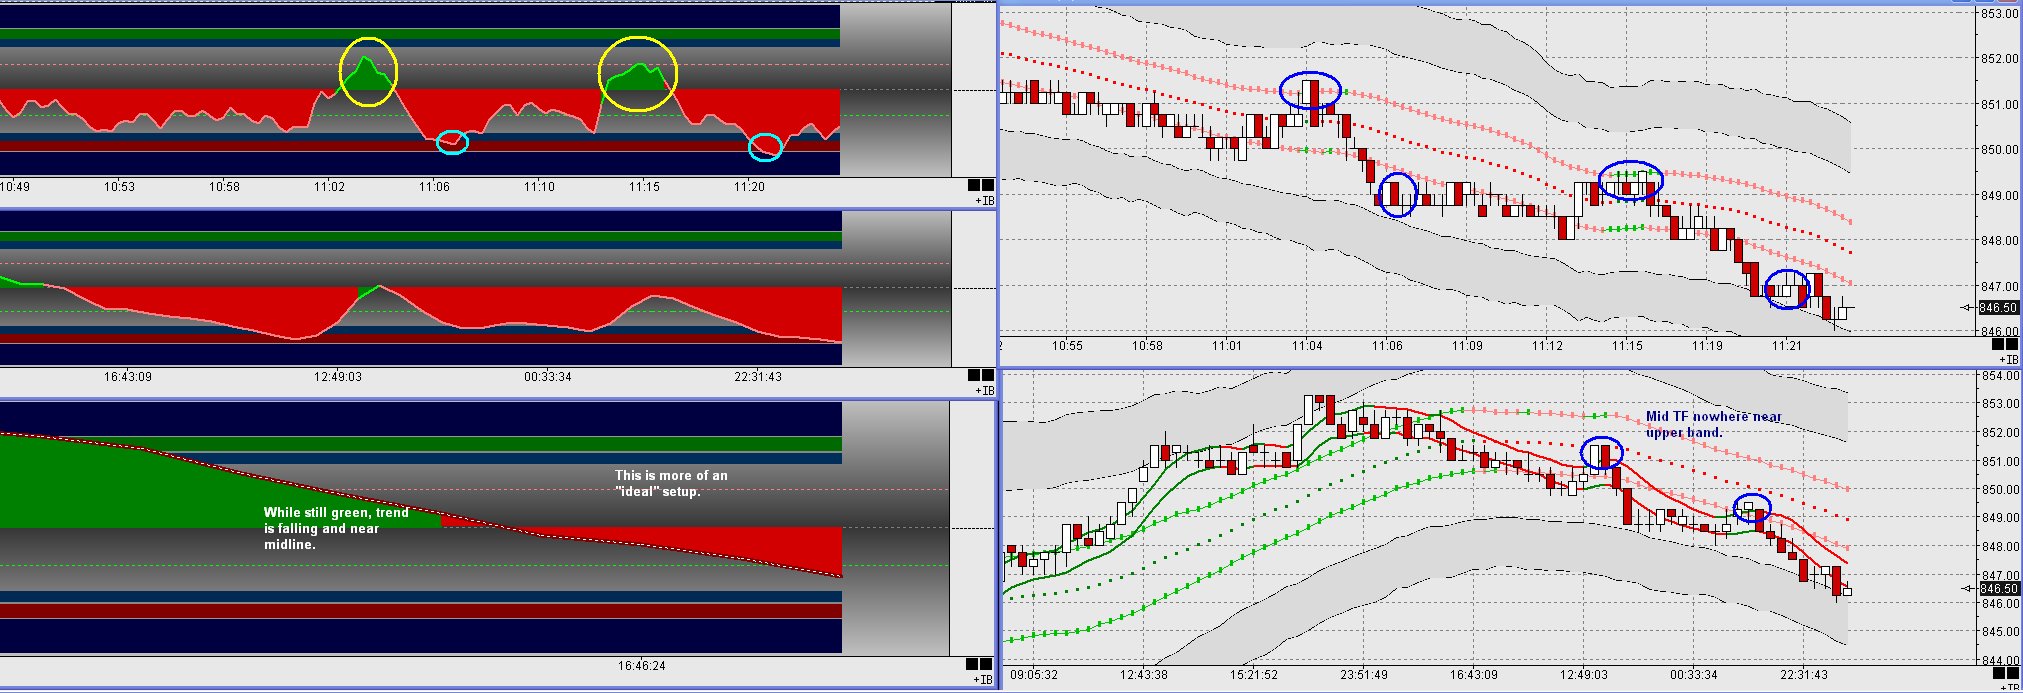
As we are fortunate to see our 2nd turn setup follow thru, we now can pick off potential pullbacks using our pullback aproach. The attached chart shows 2 nice pullback shorts on the way down. By being able to trade turns and pullbacks, we now have methodologies to trade a multitude of market offerings. I hope you find this beneficial.
Click image for original size
Last chart shows a nice long setup following the selloff from our earlier trend peak. The pullback shorts we saw in chart 2 were becoming the top of our eventual channel shown in this chart. Once again, we have an opportunity to trade the turn for a possible bounce/new trend back up. Hope you find this of value.
Click image for original size

Ninja, thanks for all the posts. I am not sure why all your charts are posting twice everywhere. Maybe DT can address this? My question is, what are your three timeframes that you are showing for your indicator? I assume your charts are the two lower of those timeframes? If it's on the charts I just can't see it... Thanks.
Jim:
I noticed the double posting as well. I first upload, then attach. Maybe Im doing this incorrectly? I thought maybe just I see it duped cause Im the one posting.
Sorry about the lack of TF info. Plus, some of my chart times are funky as well. Not sure whats happening here, but am following up with the charting software folks.
You are correct that I show the low (top) and mid (bottom) TFs on the charts with bands. These are my main focus. I also run the plain mid for channels/wedges as its easier to see without the bands and ma channel.
TFs are Low 29tick
Mid 87tick (multiple of 3)
High 435tick (multiple of 5 above mid)
The min rough equivalents are
Low 20sec
Mid 1min
High 5min
The 3 indicators are all RSIs, 7prd smoothed. Ive tried a number of other indicators, but have found these to be useful for me in both "with trend" and "against trend" setups.
I was excited to read your recent post on the rising wedge (daily) we have working. I posted a chart on the SPX also, unaware of yours. Always nice to have a little company (not too much, though, lol).
Thanks for your interest.
quote:
Originally posted by Ninja
I noticed the double posting as well. I first upload, then attach. Maybe Im doing this incorrectly? I thought maybe just I see it duped cause Im the one posting.
All you need to do is Upload and it will appear in the post. The reason that the Attach option is there is in case you want to put the same chart in another post somewhere else or later on in the topic on another page. i.e. you don't have to send everyone off to the original post to see the chart. Does that make sense.
(I've edited your posts and removed the duplicates.)
Thanks, DT, that was what I thought was going on, and I was going to post that, but you took care of it first.
quote:Thanks for the info, Ninja. I am enjoying looking at your posts. Can you tell me what the bands are on your charts, and how they play into your trading, if they do? Also, I saw you mentioned elsewhere the first negative candle for a trigger, but on which timeframe are you looking for this, as that would obviously change the trigger. Thanks.
Originally posted by Ninja
Jim:
I noticed the double posting as well. I first upload, then attach. Maybe Im doing this incorrectly? I thought maybe just I see it duped cause Im the one posting.
Sorry about the lack of TF info. Plus, some of my chart times are funky as well. Not sure whats happening here, but am following up with the charting software folks.
You are correct that I show the low (top) and mid (bottom) TFs on the charts with bands. These are my main focus. I also run the plain mid for channels/wedges as its easier to see without the bands and ma channel.
TFs are Low 29tick
Mid 87tick (multiple of 3)
High 435tick (multiple of 5 above mid)
The min rough equivalents are
Low 20sec
Mid 1min
High 5min
The 3 indicators are all RSIs, 7prd smoothed. Ive tried a number of other indicators, but have found these to be useful for me in both "with trend" and "against trend" setups.
I was excited to read your recent post on the rising wedge (daily) we have working. I posted a chart on the SPX also, unaware of yours. Always nice to have a little company (not too much, though, lol).
Thanks for your interest.
Jim:
I got started always entering on the low TF to keep my entries tighter. Originally, my low TF was a 5 multiple lower, whereas now it is 3. In looking at my charts as I mark them, I could certainly see using the mid TF. The risk is of coursethat the entry wont be as tight, but probably the candles are a bit better formed. I love spinning tops, shooting stars, solid candles as triggers, then I look to enter anywhere within a small range based upon the trigger candle. Ive tried to mark a couple for reference. I learned this "retest" method from another trader, and find it beneficial. In answer though, I do currently key off my low TF. Due to the smaller TF, the candles are quite as nicely defined, so I tend to look for something close to those mentioned, but with some degree of candle body (red or white) rather than crosses. My preference only. This applies to entering turns.
Regarding the bands, all are Keltners. The outer grey bands give me boundaries and some help with definition as to choppy markets, trending, extended etc. They also give me an immediate "feel" for being overbought/oversold. How price reacts when near/contacting them helps me also. As for the inner green/pink bands, keltners also. These are really there for purllbacks. I use the low TF only to enter, and will ideally reach the opposing band (bottom green for longs, etc) where I will enter on band touch. This can be good/bad of course, but Im not a big fan of having a lot of "confirmation". Most of the time it only costs money to "see" price moving in ones favor, and that is no guarantee that it will continue to anyway. The vast majority of the time by doing this I will have a good enough entry to allow for a "graceful" exit if trade isnt working. If it just takes off against me, well, thats what stops are for. :-)
Since Im supposedly with "the trend", (as opposed to trading turns), I feel the bigger should win over anyway, thats the point of trading "with trend" to me.
The bands are all 30prd simple, with varying multipliers. based upon H/L/C div 3. Nothing magic, just something Ive gotten accustomed to.
My high TF chart has a small channel which I find pretty helpful. Its an 8prd weighted H/L channel. It tends to highlite pullbacks and strength of trend (bars basically outside of channel, then moving in).
I hope somewhere in all this rambling theres a morsel of insight to be gleened! lol Cant promise though. :-)
I always appreciate observations/comments by others as one can get "tunnel vision" sometimes, seeing the same thing over and over. So, dont hesitate!!!
I hope Ive not overdone the number of posts! Im cursed to have been exposed to so many methodologies, and knowing just enough to be dangerous about all of them. lol Im trying to become really effecient trading pullbacks (but my heart still lies with turns) Anyway, better stop........... Thanks for your interest.
Emini Day Trading /
Daily Notes /
Forecast /
Economic Events /
Search /
Terms and Conditions /
Disclaimer /
Books /
Online Books /
Site Map /
Contact /
Privacy Policy /
Links /
About /
Day Trading Forum /
Investment Calculators /
Pivot Point Calculator /
Market Profile Generator /
Fibonacci Calculator /
Mailing List /
Advertise Here /
Articles /
Financial Terms /
Brokers /
Software /
Holidays /
Stock Split Calendar /
Mortgage Calculator /
Donate
Copyright © 2004-2023, MyPivots. All rights reserved.
Copyright © 2004-2023, MyPivots. All rights reserved.