Charts 04-15-09 (Not by KoolBlue, but by rookie)
Hi all,
Please be warned that this is not a topic that Guru KoolBlue started, but is one started by a newbie. Therefore, what I post here is certainly not going to be of that high proficiency.
I have been trying to get myself ramped up on this methodology and have been trying to make my own predictions (and thus use that info to trade). Forgive me if I make mistakes - it is not my intention to derail anyone else.
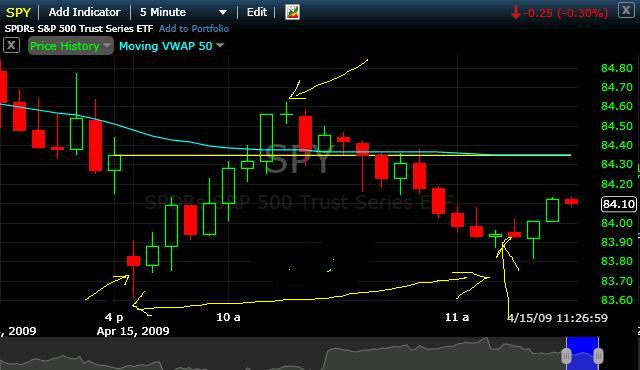
Based on the chart below (5-min SPY), it looks like we are setting up for 13 points (1.6 * (846-838)) above 846 [that would be 859] in 90 minutes from now (1PM EST). I used the candles pointed by the arrows to come to this conclusion.
I appreciate any feedback.
Thanks.
Please be warned that this is not a topic that Guru KoolBlue started, but is one started by a newbie. Therefore, what I post here is certainly not going to be of that high proficiency.
I have been trying to get myself ramped up on this methodology and have been trying to make my own predictions (and thus use that info to trade). Forgive me if I make mistakes - it is not my intention to derail anyone else.
Based on the chart below (5-min SPY), it looks like we are setting up for 13 points (1.6 * (846-838)) above 846 [that would be 859] in 90 minutes from now (1PM EST). I used the candles pointed by the arrows to come to this conclusion.
I appreciate any feedback.
Thanks.
Click image for original size
great work, shop! looks valid to me!
Well, I do not think my prediction came to pass. It did look like we hit 853 by end of day, but I am certain that was just a stroke of luck. Oh, well! Time to hit the books again.
Click image for original size
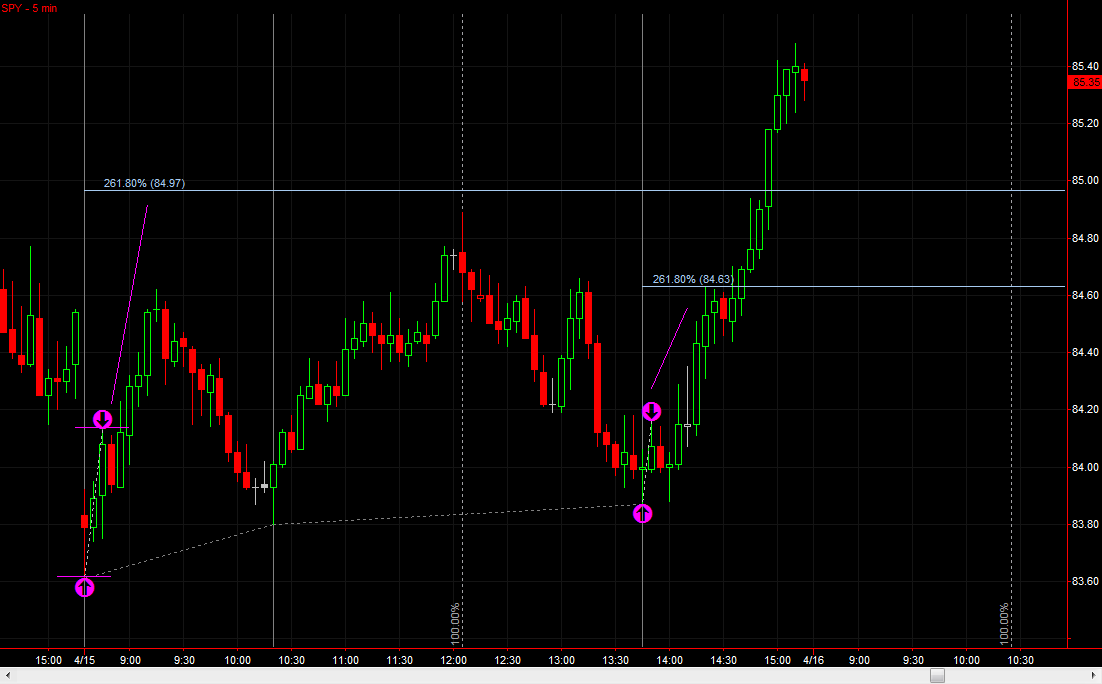
Hi VOWater,
Thanks much for the chart. This clarifies things better. I think I took into account a stretch with red candles included.
Appreciate it.
Thanks much for the chart. This clarifies things better. I think I took into account a stretch with red candles included.
Appreciate it.
Click image for original size
SHOPSMART , As far as price projection goes ,use the first initial move before any decent retrace times 1.618 and add to the end of the move. or multiply by 2.618 times the initial move added to the end of the initial move.
Emini Day Trading /
Daily Notes /
Forecast /
Economic Events /
Search /
Terms and Conditions /
Disclaimer /
Books /
Online Books /
Site Map /
Contact /
Privacy Policy /
Links /
About /
Day Trading Forum /
Investment Calculators /
Pivot Point Calculator /
Market Profile Generator /
Fibonacci Calculator /
Mailing List /
Advertise Here /
Articles /
Financial Terms /
Brokers /
Software /
Holidays /
Stock Split Calendar /
Mortgage Calculator /
Donate
Copyright © 2004-2023, MyPivots. All rights reserved.
Copyright © 2004-2023, MyPivots. All rights reserved.