ES 30min RSI overbought/oversold
Click image for original size
Click image for original size

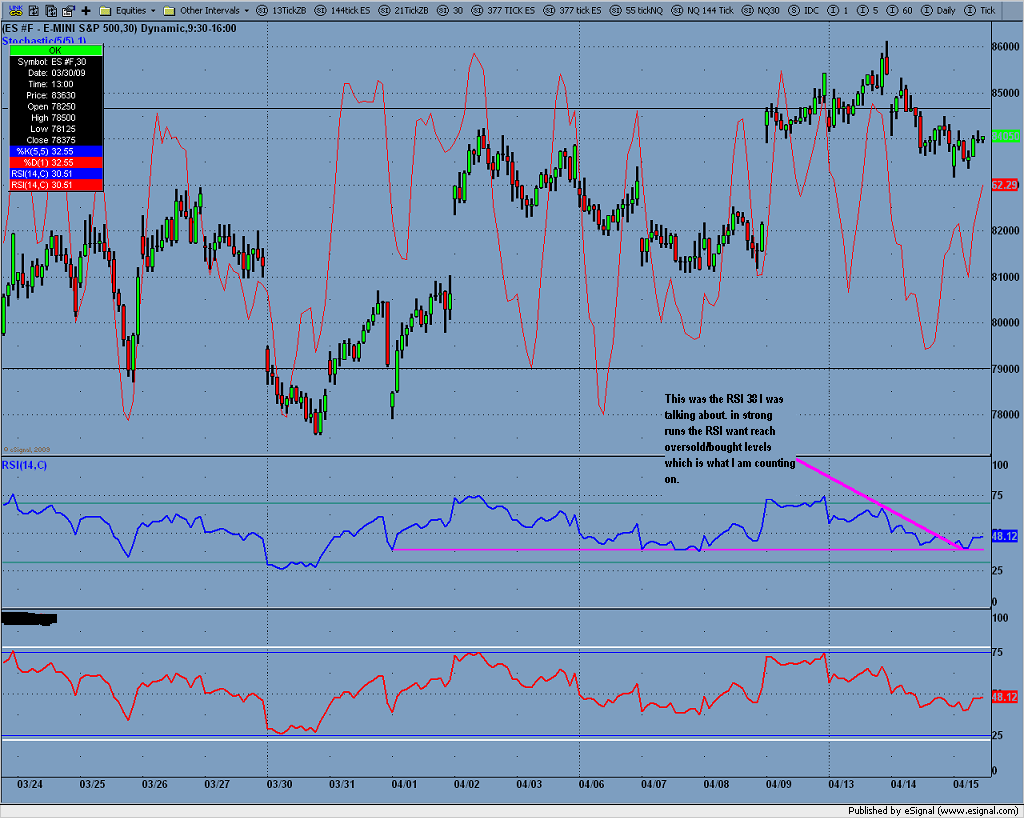
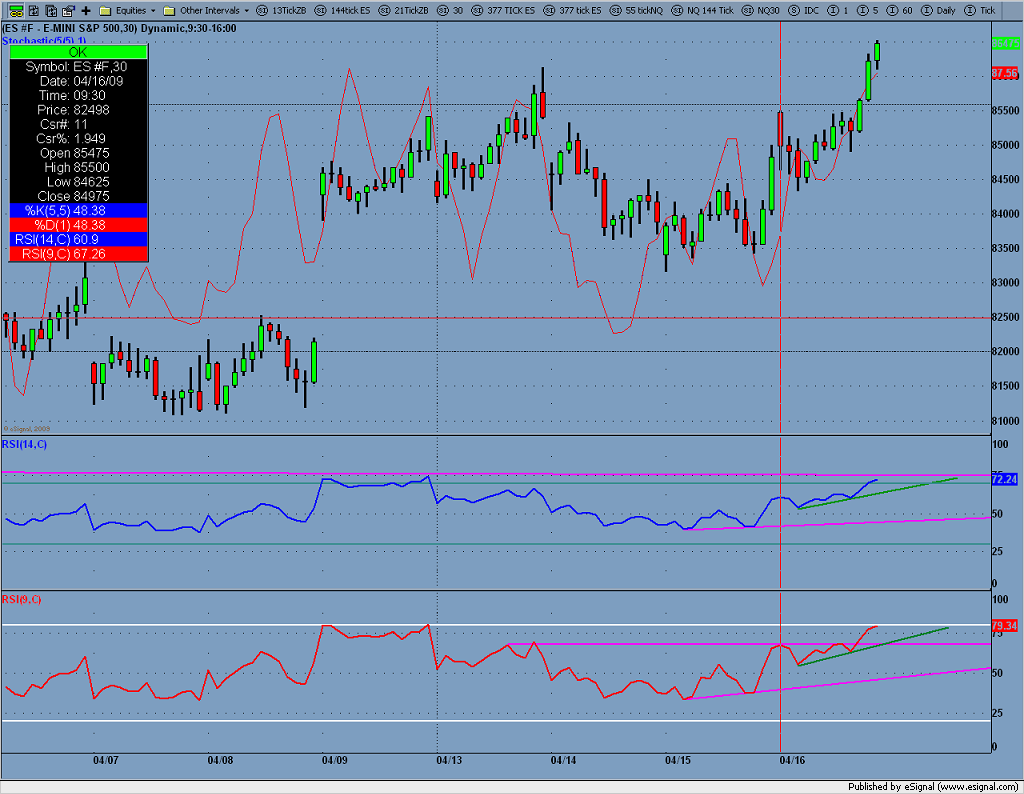
In a normal trending market it takes 25 about 30min bars to go from overbought to oversold, and visa versa. In a slower market it takes 35 30min bars. We are in the 35 bar rotation now, and 11 bars into it, which tells me we will make a high around 865-870 in about 20 bars or 13:00 time Monday.
Also overbought/oversold is a point of view of the trader. When a market keeps making new highs and trending well by the time you get a RSI reading of 30 the move will be done its likely to retrace no more than 45. And the same going up...
Also overbought/oversold is a point of view of the trader. When a market keeps making new highs and trending well by the time you get a RSI reading of 30 the move will be done its likely to retrace no more than 45. And the same going up...
quote:
Originally posted by CharterJoe
I wonder if there is a way to overlay a MA envelope over the RSI?
Not with E-signal, ohh well. I will plot it by hand I guess. I'll post if anything interesting occurs...
Click image for original size
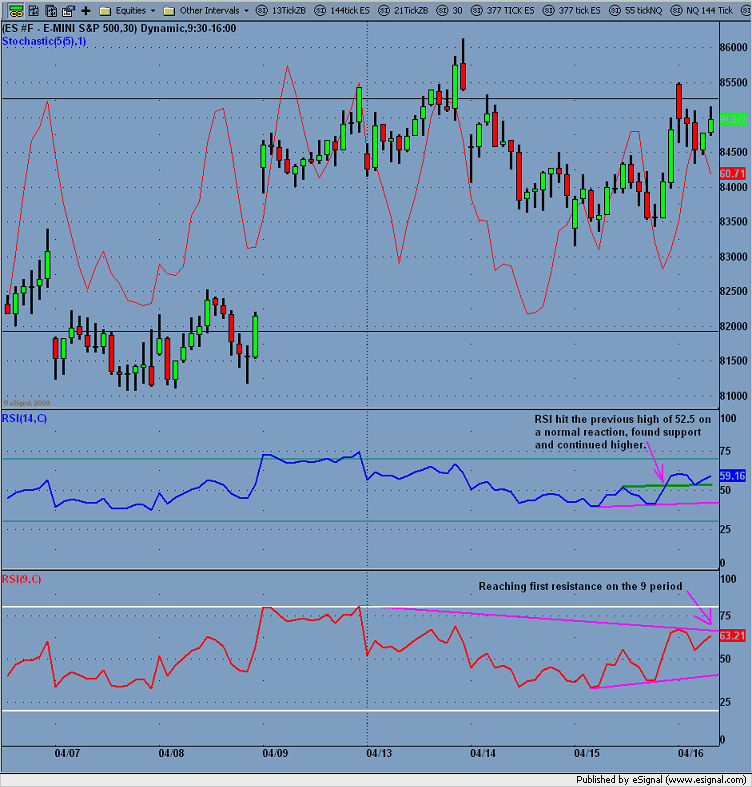
You can also a low and high on RSI and get the 50% mark which this last move it would be 57.5, the level we have been hovering around since the open. The 50% retrace marked the low of the gap down on monday 4/13 at 842 when we ran too 861....
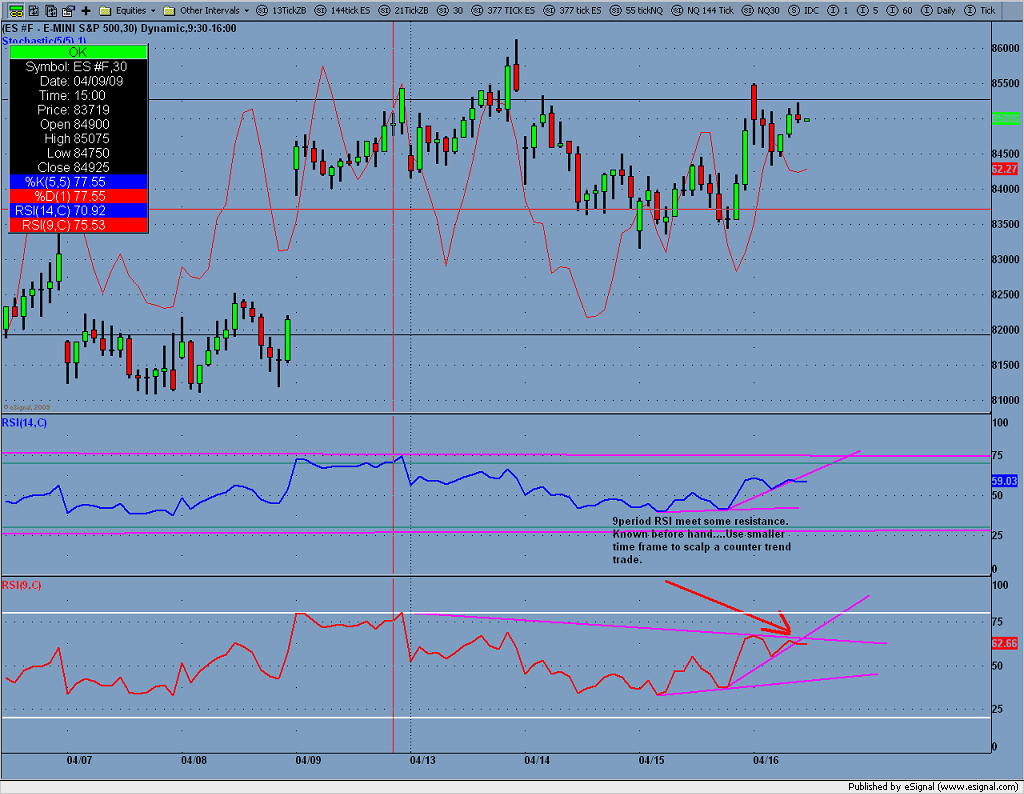
This is how I use 30min RSI to aid in all my trades...
Click image for original size
Click image for original size
Click image for original size
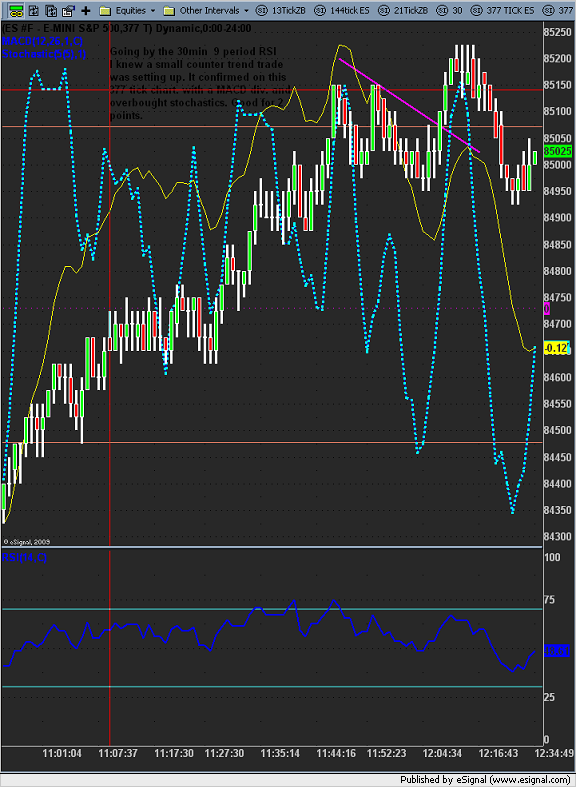
Alright +$1.00 on those calls better than 33%. Markets looking overbought going to pick up some puts near the close hopefully around 871. Should have been +1.50 but error on my part and clicked the wrong options contract.
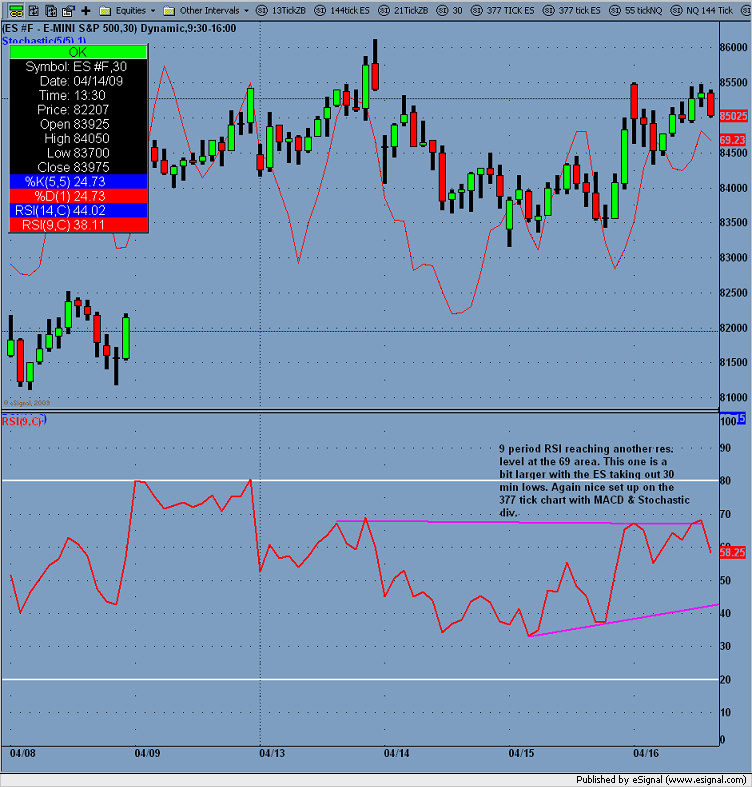
According to my charts looks like we are going to get a pull back around RSI 74-75...
According to my charts looks like we are going to get a pull back around RSI 74-75...
Click image for original size
Looks like a good short with both RSI arriving at overbought and RSI 14 ahead of some major resistance looks good for at least -25 points.
Picked up some SPY may 86 puts @ 3.25 ES @ 864
<edit;looking for 1 point on those puts thats ES @ 840ish level>
Click image for original size
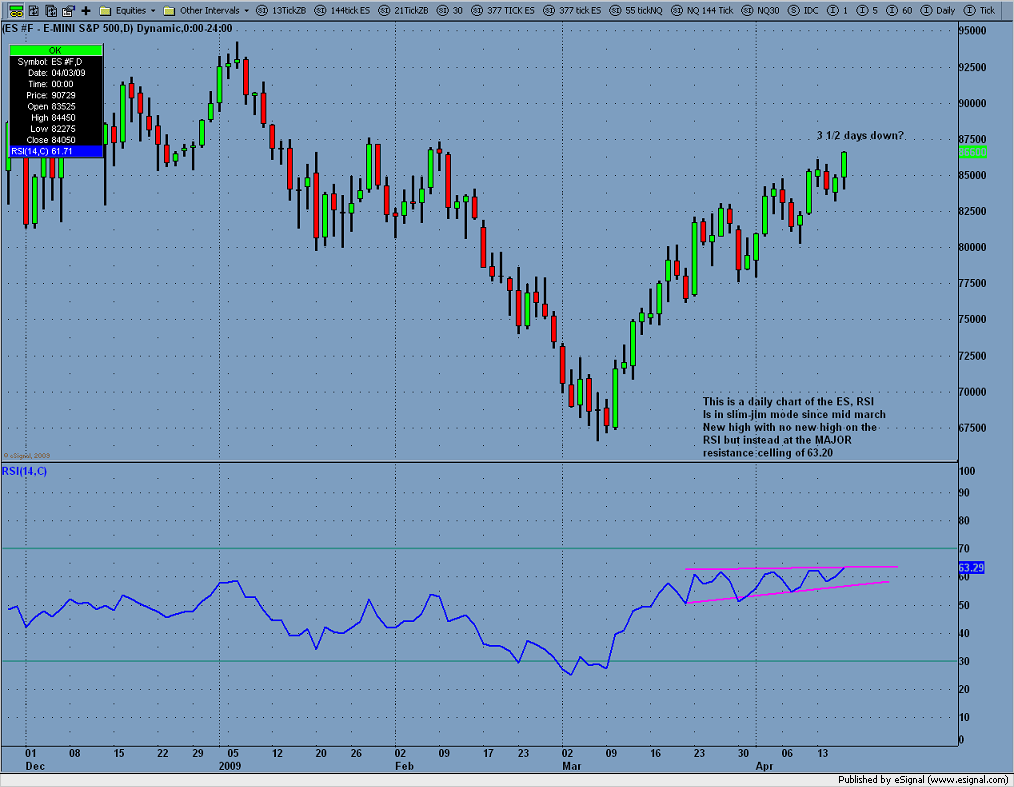
Always makes me a bit nervous going the opposite way of big trends like these puts I have with the ES 200pts off the lows. But if your trading in your comfort zone your not making anything.
Joe;
Have you used the ADX. If so what time frame?
Thanks
Have you used the ADX. If so what time frame?
Thanks
Emini Day Trading /
Daily Notes /
Forecast /
Economic Events /
Search /
Terms and Conditions /
Disclaimer /
Books /
Online Books /
Site Map /
Contact /
Privacy Policy /
Links /
About /
Day Trading Forum /
Investment Calculators /
Pivot Point Calculator /
Market Profile Generator /
Fibonacci Calculator /
Mailing List /
Advertise Here /
Articles /
Financial Terms /
Brokers /
Software /
Holidays /
Stock Split Calendar /
Mortgage Calculator /
Donate
Copyright © 2004-2023, MyPivots. All rights reserved.
Copyright © 2004-2023, MyPivots. All rights reserved.