Indicators 4219
Indicators....I hear a lot of pro traders say not to use them. I believe they should not be used alone but with price as the main influence they can be very profitable. When I started trading I never used a signal indicator, I used Point-and-Figure charts and trend lines, Gann square of nine, and Gann 1/8ths (almost the same as Fibonacci numbers) then some time later added indicators. I wonder why indicators get such a bad rap? I never hear Pro Day Traders say that the bar chart doesn't work to me that seems just as silly.
There are days where I will not watch my indicators, I think tomorrow is going to be a day like that. Because we are down almost 1% in after hours and we have had a contraction in price movement its ready for a trend day. Then after a trend day (or 2) its time to turn the indicators on again and go counter trend. There is no written in stone rules for this it just something I can feel.
There are days where I will not watch my indicators, I think tomorrow is going to be a day like that. Because we are down almost 1% in after hours and we have had a contraction in price movement its ready for a trend day. Then after a trend day (or 2) its time to turn the indicators on again and go counter trend. There is no written in stone rules for this it just something I can feel.
I think that every trader should have 2 sets of indicators. One set that they use about 20% of the time which are good in trending and semi-trending markets and the other set (oscillators) that are great for Z-Days. Then, and this is the difficult part that I have not yet solved, is to find some way of determining early on in the day which set of indicators to use.
Indicators get a bad rap because they are derived from price and thus are "once removed" which leads to lag and distortion. By distortion I mean they drift around and tend to get completely lost at times. Take your favorite indicator and run it against a perfect sine wave and see what happens. Then run it against a perfect trend.
Also, indicators are the training wheels new traders tend to grab onto as fast as possible because they have no training or real-world experience in reading basic price action (not to mention even being aware of the existence of complex price and time patterns). New traders have no more idea how to trade profitably from an indicator than a price chart, but because the indicator smooths out the price action a little it seems more safe to use. They soon learn otherwise.
Finally, its "cool" to be able to say I don't use indicators. I guess it gives folks a sense of self worth or standing in the trading community.
I personally have no problem with indicators. I do think some indicators are better than others. I use a very specific set of indicators to help me with my trading each day. I rarely ever change my workspace/chart/indicator setup. For example, I have one specific moving average that I use every day. I rely heavily on this moving average, and have no rational reason to trade without it. It just makes my life a little easier to have that indicator on my chart than to leave it off. I am a bit lazy and using my indicators helps me not to have to work as hard during the day. I can glance at the chart and know what to do, and when I don't "get it", I know enough to admit that and stay out of the way until I do. Can I trade without indicators, certainly, no question about it whatsoever. I can say this with 100% certainty because I can accurately read a price bar chart. I can also trade without a price chart, and do so on occasion. I can claim this as well, because I can read price action on my time and sales and order book. I have a friend who is a former floor trader that does exactly that every morning, he never uses price charts much less indicators. He does this because he knows price charts are in reality derived from the Time and Sales, thus are also once removed, and the signals emitted from a price chart are lagged just like indicators are. If you want pure zero lag trade signals, use your Time and Sales.
You can lose just as much money trading from a pure price chart as you can using an indicator, perhaps even more money. If you doubt this, take a new trader and try to teach them to trade profitably from pure price action. It's a lot easier said than done. Also, I have not met many traders who use just one price chart. What I run into is traders using high end computer systems with multiple monitors and a dozen or more different charts visible, usually with every time frame imaginable. So if price action is the end-all/be-all method of "pro traders" why is everyone using 15 or 20 different price charts ? If the answer is price action, then 2 or 3 charts should be more than sufficient to see the price action, should'nt it ? Is looking at 15 charts of the ES any more helpful (or profitable) than using a reliable indicator on one or two charts ?
I utilize a combination of price patterns, indicators and tape reading. My current workspace has 5 price charts along with a filtered T&S and the order book (DOM). I will get rid of one of those 5 price charts soon, because I am only using it to test a new indicator I am developing
Great insights here! I see no reason to not trade both with/without indicators. A little AC/DC surely is a good thing, right? lol
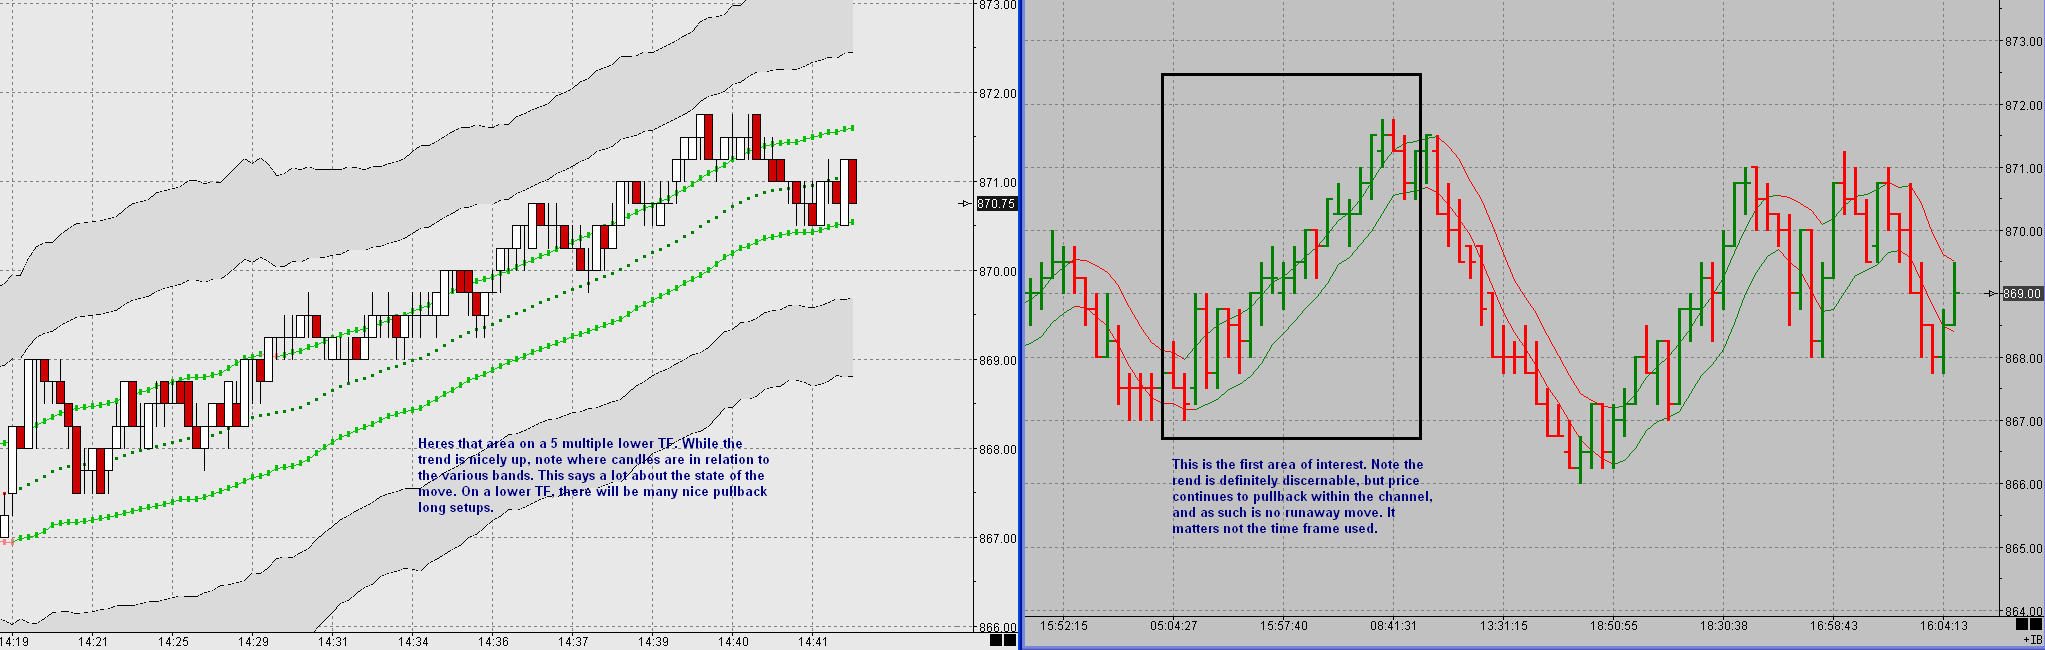
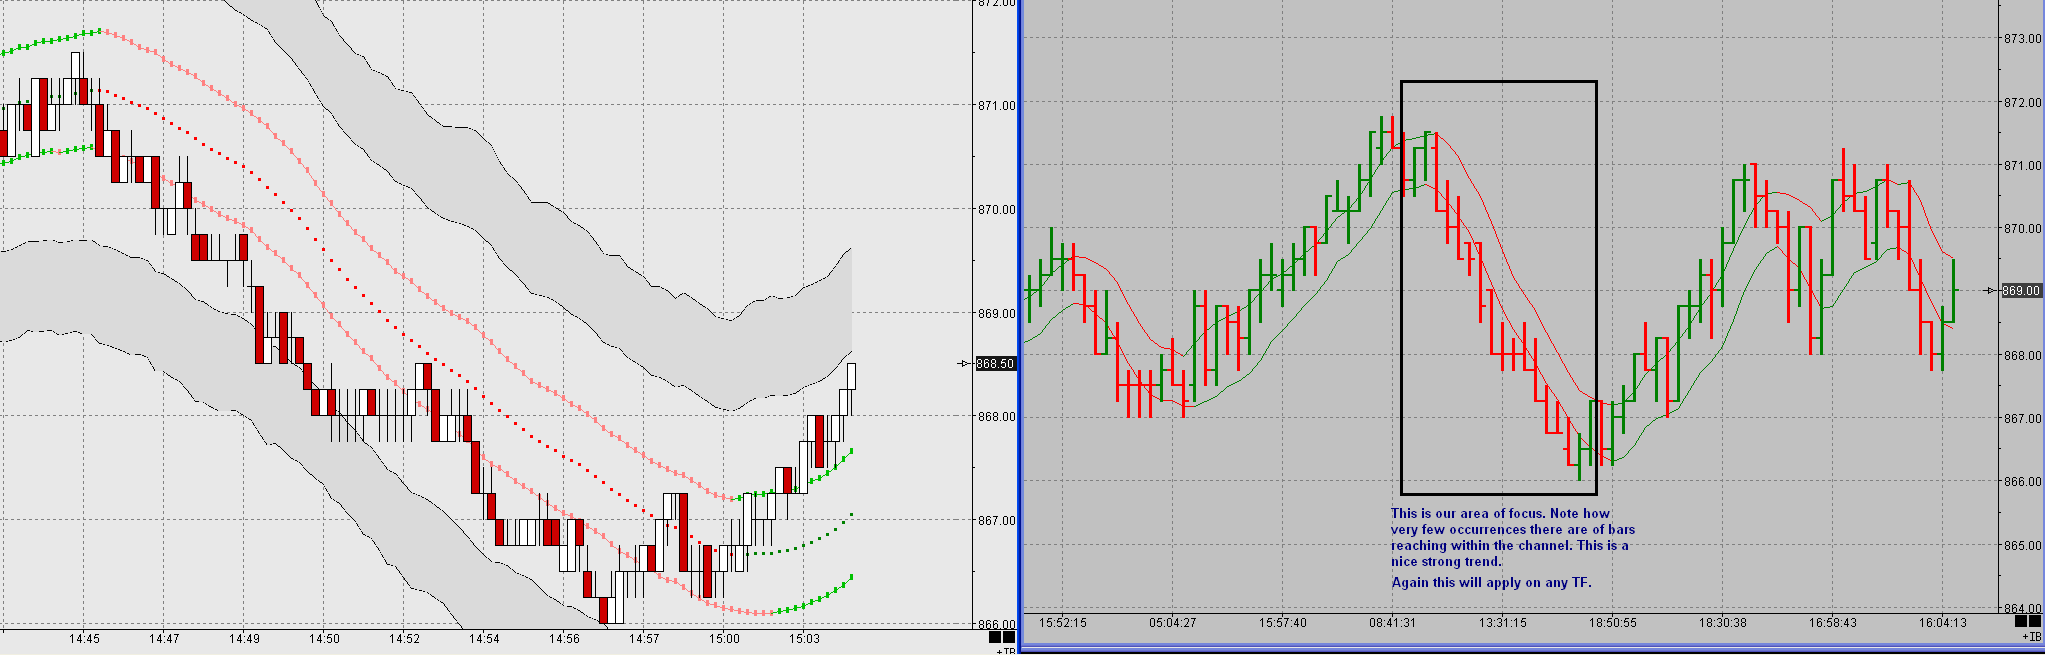
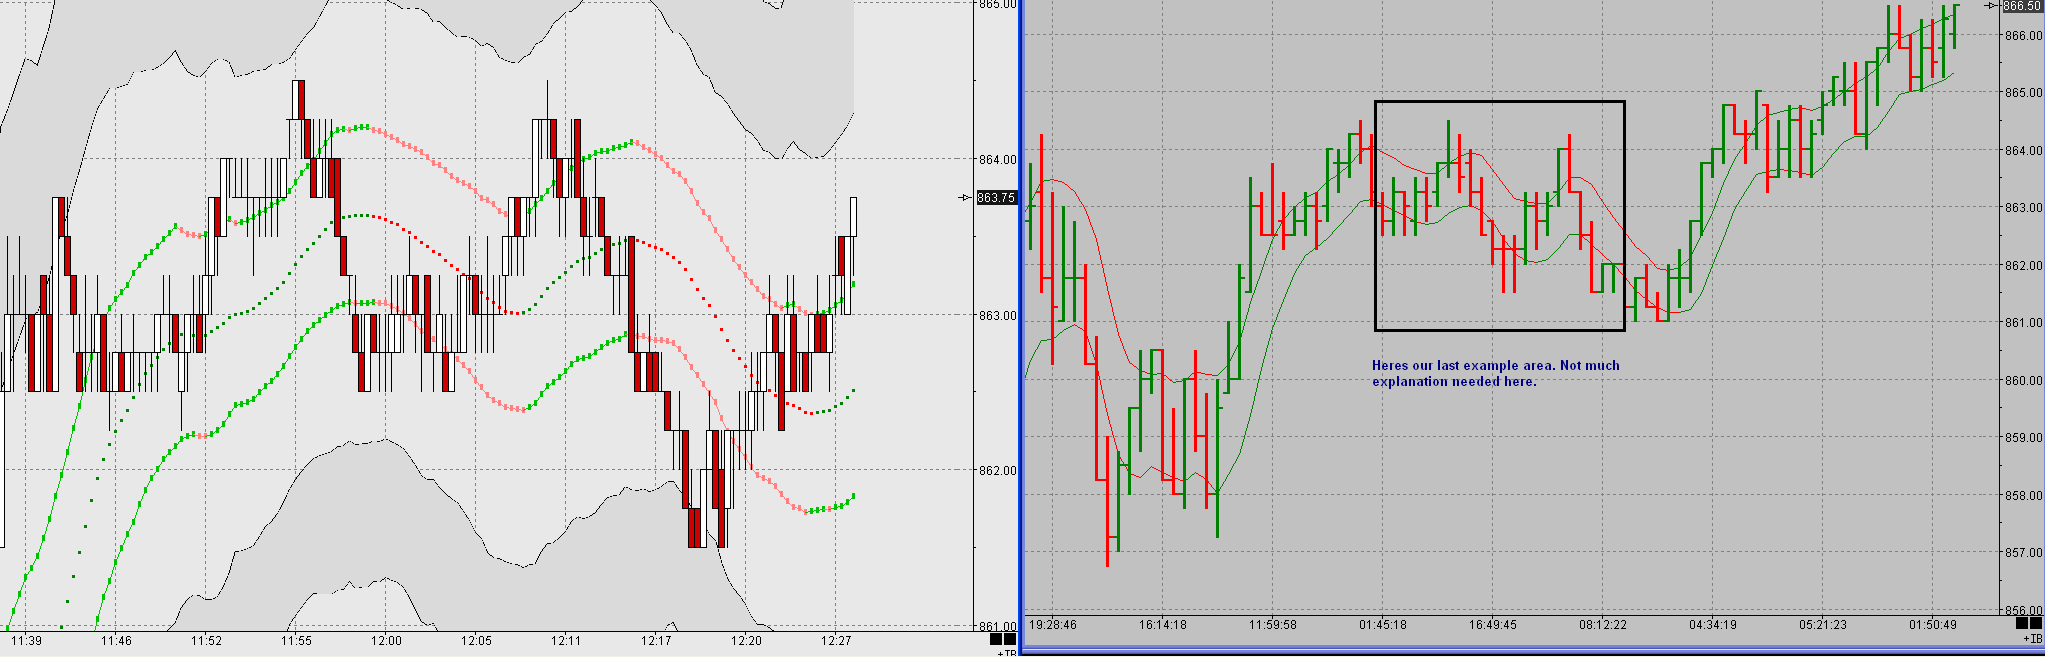
Ive found that trading wedges/channels/sup-res can be done with no indicators quite nicely. Its the foundation of my trading for sure. But, Im a sucker for a good oscillator (RSI), as it(they) can help with turns that are not easily defined by the patterns I look for. They can also be helpful with pullbacks (useful in trending markets, whether strong or orderly) by dropping down in TFs and trading them like a turn (which of course every pullback must be to reverse and resume in the trend direction).
I do see that knowing before the day starts what type of market is coming is problematic. If you figure out that, please holler, and I can suggest a great beach where we can all go live !! :-)
Ive thrown in 3 charts showing some tools I find useful in market condition analysis, but of course, it takes some activity to build. Unless you can do something like the 3day system (think it was Angell?) where 1 is a trend day, 1 a pause day, 1 a reversal day, or something to that effect, Im not sure how (or if) this dilemna can be solved.
Anyway, just a devalued "2 cents" to throw in. :-)
Click image for original size
Click image for original size
Click image for original size
quote:
Originally posted by Ninja
..
I do see that knowing before the day starts what type of market is coming is problematic. If you figure out that, please holler, and I can suggest a great beach where we can all go live !! :-)
Ive thrown in 3 charts showing some tools I find useful in market condition analysis, but of course, it takes some activity to build. Unless you can do something like the 3day system (think it was Angell?) where 1 is a trend day, 1 a pause day, 1 a reversal day, or something to that effect, Im not sure how (or if) this dilemna can be solved.
Anyway, just a devalued "2 cents" to throw in. :-)
..
it's called taylor book method. It's disscussed thouroughtly in this tread http://www.mypivots.com/forum/topic.asp?TOPIC_ID=3237
Emini Day Trading /
Daily Notes /
Forecast /
Economic Events /
Search /
Terms and Conditions /
Disclaimer /
Books /
Online Books /
Site Map /
Contact /
Privacy Policy /
Links /
About /
Day Trading Forum /
Investment Calculators /
Pivot Point Calculator /
Market Profile Generator /
Fibonacci Calculator /
Mailing List /
Advertise Here /
Articles /
Financial Terms /
Brokers /
Software /
Holidays /
Stock Split Calendar /
Mortgage Calculator /
Donate
Copyright © 2004-2023, MyPivots. All rights reserved.
Copyright © 2004-2023, MyPivots. All rights reserved.