Monkey Weekend ES Analysis
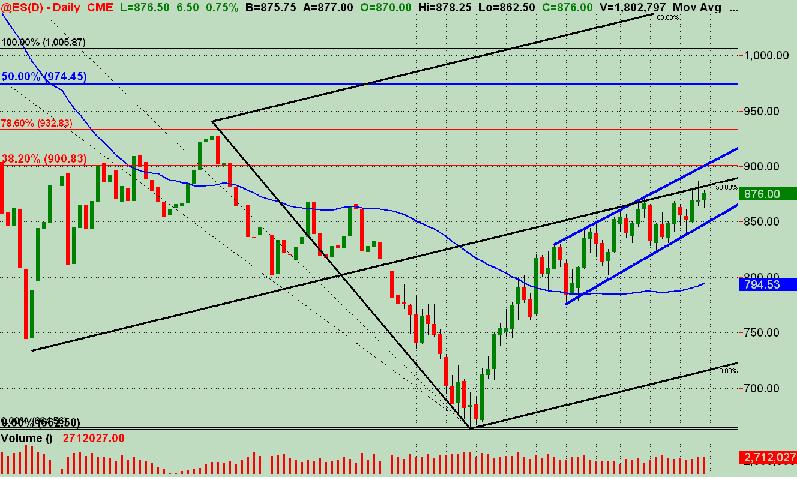
Daily Chart: Midline (Andrew’s Pitchfork), black line in the area of 884 as potential RESISTANCE … potential “significant” SUPPORT at lower blue trend line in 850-852 area with the Weekly S1 Pivot at 847.25.
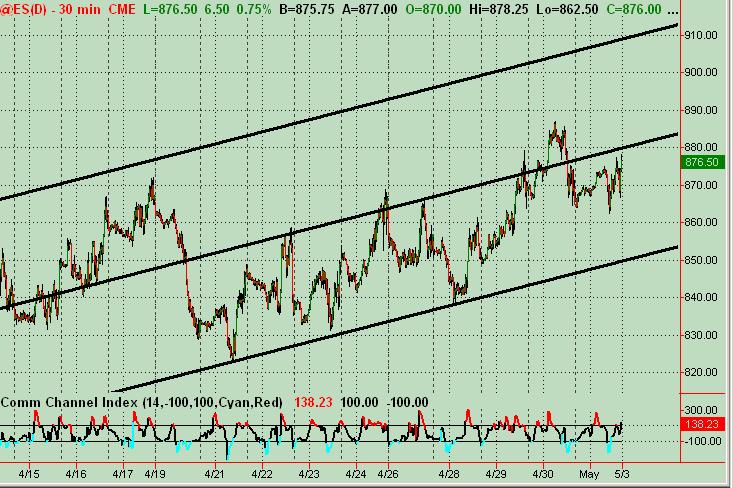
30 Minute Chart: Trend channel black midline at 880-882 … with the daily R1 Pivot at 882 … and a .786 fib retracement using Regular Trading Hours from 5/1 low to 4/30 high comes in at 880.50 … shows some confluence in area of 880-882 as potential RESISTANCE with the daily chart’s Andrew’s Pitchfork potential RESISTANCE just 2 points higher at 884.
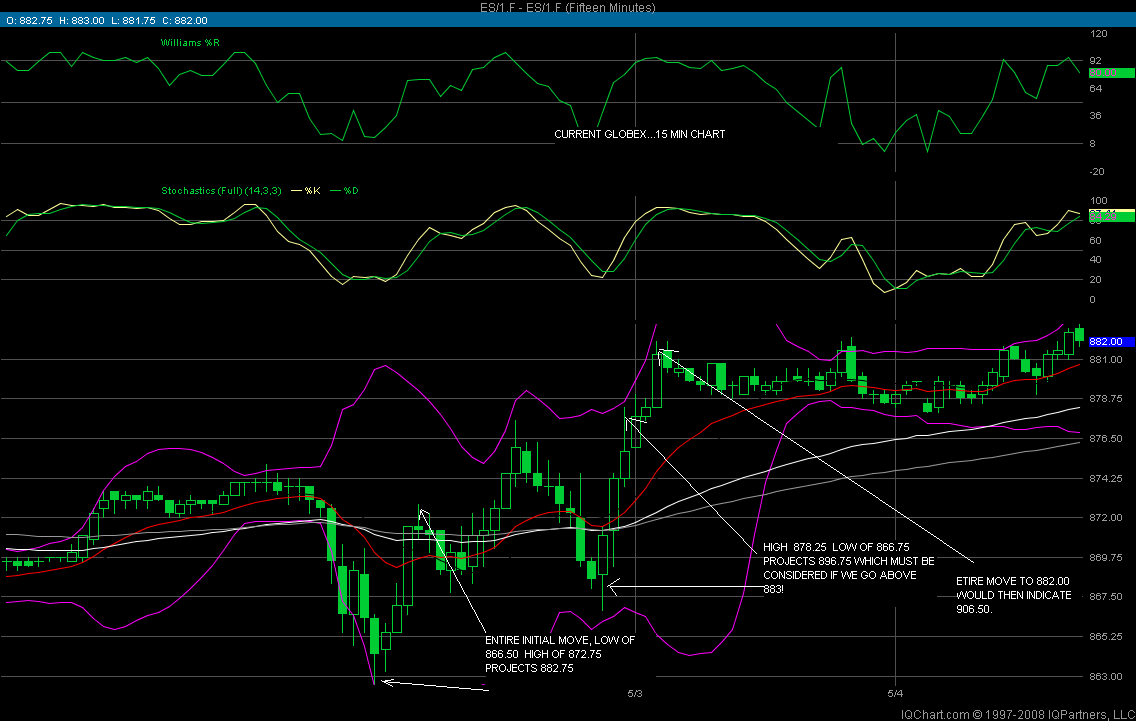
13 Minute Chart: Shows price action RESISTANCE at 879.75-880.50 and then at 885. Initial price action SUPPORT at 867.50 that clusters with daily Market Profile VAL of 866.75 and weekly “average price” Floor Pivot at 867.25 and the daily S1 Pivot at 866.25 … providing a confluence/cluster of potential SUPPORT in the 866.25-867.50 zone. The next SUPPORT level below that from price action looks like 861.75-862.50.
SUMMARY: RESISTANCE @ 879.75-882 (885 as an extreme, and if penetrated and held, room to run to 900) … SUPPORT @ 866.25-867.50, and 861.75-862.50 … and 850-852 very significant.
Charts posted below.
30 Minute Chart: Trend channel black midline at 880-882 … with the daily R1 Pivot at 882 … and a .786 fib retracement using Regular Trading Hours from 5/1 low to 4/30 high comes in at 880.50 … shows some confluence in area of 880-882 as potential RESISTANCE with the daily chart’s Andrew’s Pitchfork potential RESISTANCE just 2 points higher at 884.
13 Minute Chart: Shows price action RESISTANCE at 879.75-880.50 and then at 885. Initial price action SUPPORT at 867.50 that clusters with daily Market Profile VAL of 866.75 and weekly “average price” Floor Pivot at 867.25 and the daily S1 Pivot at 866.25 … providing a confluence/cluster of potential SUPPORT in the 866.25-867.50 zone. The next SUPPORT level below that from price action looks like 861.75-862.50.
SUMMARY: RESISTANCE @ 879.75-882 (885 as an extreme, and if penetrated and held, room to run to 900) … SUPPORT @ 866.25-867.50, and 861.75-862.50 … and 850-852 very significant.
Charts posted below.

This is my roadmap/template for coming into Monday. Would like any feedback/commentary and additional inputs of analysis and charts here. Have at it!
An additional observation ... Friday was a NR4 day using RTH. Also, it's range was contained within Thursday's low and Friday's high as we seem to be cycling into a range contraction here. Often this precedes a significant breakout (either up or down) with follow through for at least the short term. Then again, it could simply remain in a trading range for a bit ... which is always the Million Dollar Question. If anyone has some specific ideas and analysis on this ... would be much appreciated.
Jan. 11th of this year, 70 minute chart, 16:20 -00:00, the double bottom at 880 is why we turned. The mean high of that movement was 85. That's price satisfaction. We went to beat it (base). They ticked it and dumped hard. That, and bulls' own 60 degree at 886.02 gells with your top-most pivot. Also, I saw this same action from mid Jan to mid Feb before they drove it south.
I wouldn't do anything but three bar break scalps against the trend until they figure out what they're doing. I think everyone's on the same page looking to ceiling 50.
Caught the NR4 too. Couldn't make anything else out of it though. Suffice it to say I didn't crunch any numbers.
I wouldn't do anything but three bar break scalps against the trend until they figure out what they're doing. I think everyone's on the same page looking to ceiling 50.
Caught the NR4 too. Couldn't make anything else out of it though. Suffice it to say I didn't crunch any numbers.
Bulls have to hold a retrace arm somewhere before reaching, and then underneath, 665 before this bear market goes away.
All those run up bull headfakes and bears crushing their gains every half hour indicates bias and momentum is changing.
They already began selling the open.
All those run up bull headfakes and bears crushing their gains every half hour indicates bias and momentum is changing.
They already began selling the open.
Friday was a NR7, we closed in the upper end of the range Friday after that bearish looking close Thursday. Looks like we are headed for some more up trend days next week as volatility wound down. And I would love to see an upside break which is were my money is, but a down break would be just fine too as $ is only a click away.
The 30 min ES is in a nice up channel and even the minor pull back we are in is in an up channel lol its like summer 2006. 30 min RSI is bullish showing an up cycle is coming into the 30min RSI and should last until Tuesday afternoon and if it would up run into the close on Tues would be best to drive those put premiums down, which would be a good time to buy puts which puts the ES at 900 and the RSI over 72ish level.
The 30 min ES is in a nice up channel and even the minor pull back we are in is in an up channel lol its like summer 2006. 30 min RSI is bullish showing an up cycle is coming into the 30min RSI and should last until Tuesday afternoon and if it would up run into the close on Tues would be best to drive those put premiums down, which would be a good time to buy puts which puts the ES at 900 and the RSI over 72ish level.
If bulls don't hold 64.75 testing 62 this bull rally is done.
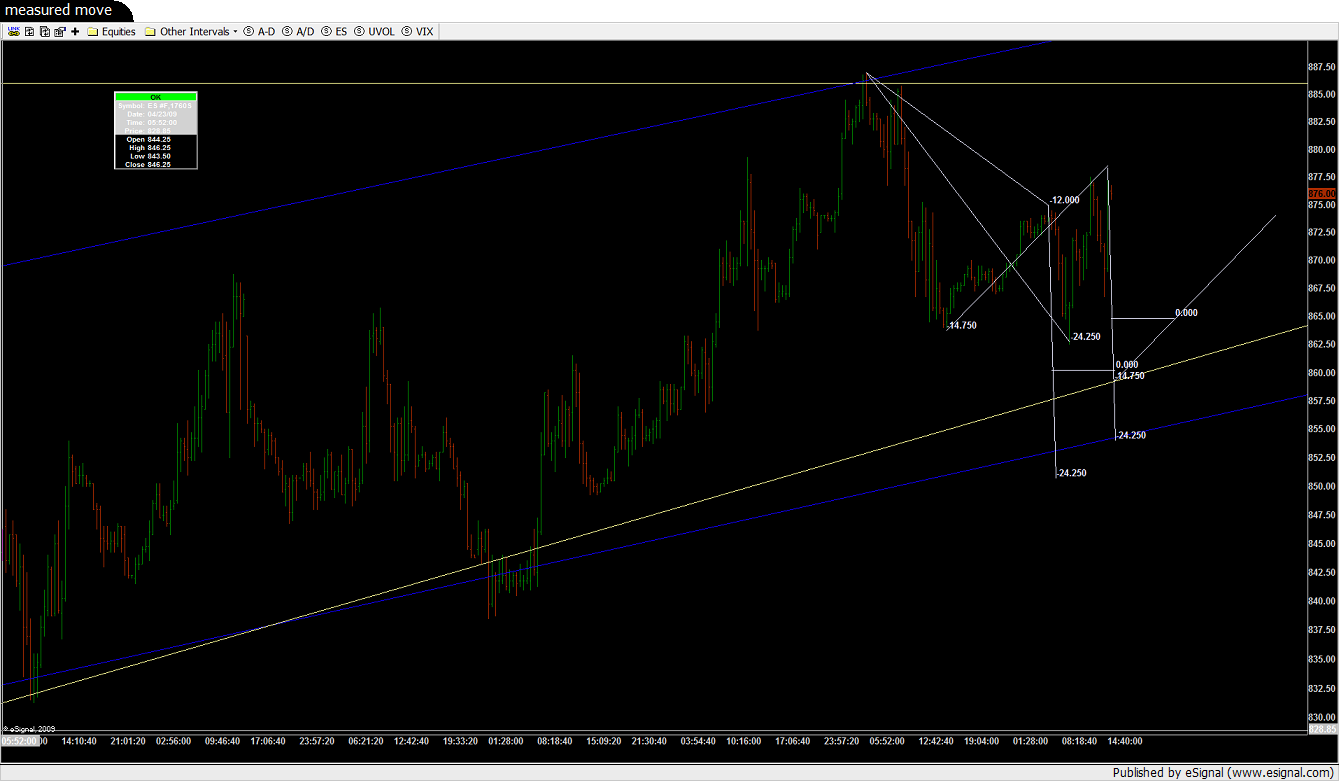
A measured move from the top comes in at 850.50
A measured move from the top comes in at 850.50
Click image for original size
Scratch that I forgot something. 8:31:09 PM retrace bounce bear bias.
Tues. 8:04:09 PM bottom
quote:
Originally posted by CharterJoe
should last until Tuesday afternoon and if it would up run into the close on Tues would be best to drive those put premiums down, which would be a good time to buy puts which puts the ES at 900 and the RSI over 72ish level.
Tues. 8:04:09 PM bottom
Click image for original size
Emini Day Trading /
Daily Notes /
Forecast /
Economic Events /
Search /
Terms and Conditions /
Disclaimer /
Books /
Online Books /
Site Map /
Contact /
Privacy Policy /
Links /
About /
Day Trading Forum /
Investment Calculators /
Pivot Point Calculator /
Market Profile Generator /
Fibonacci Calculator /
Mailing List /
Advertise Here /
Articles /
Financial Terms /
Brokers /
Software /
Holidays /
Stock Split Calendar /
Mortgage Calculator /
Donate
Copyright © 2004-2023, MyPivots. All rights reserved.
Copyright © 2004-2023, MyPivots. All rights reserved.