Monkey Weekend ES Analysis
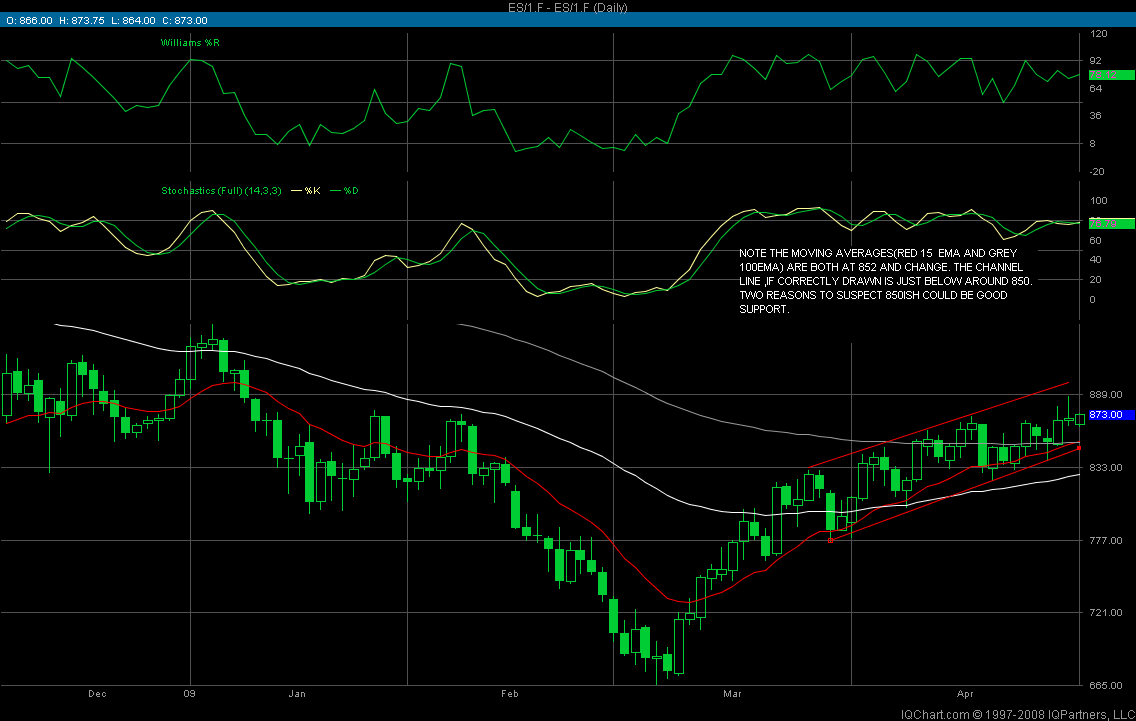
Daily Chart: Midline (Andrew’s Pitchfork), black line in the area of 884 as potential RESISTANCE … potential “significant” SUPPORT at lower blue trend line in 850-852 area with the Weekly S1 Pivot at 847.25.
30 Minute Chart: Trend channel black midline at 880-882 … with the daily R1 Pivot at 882 … and a .786 fib retracement using Regular Trading Hours from 5/1 low to 4/30 high comes in at 880.50 … shows some confluence in area of 880-882 as potential RESISTANCE with the daily chart’s Andrew’s Pitchfork potential RESISTANCE just 2 points higher at 884.
13 Minute Chart: Shows price action RESISTANCE at 879.75-880.50 and then at 885. Initial price action SUPPORT at 867.50 that clusters with daily Market Profile VAL of 866.75 and weekly “average price” Floor Pivot at 867.25 and the daily S1 Pivot at 866.25 … providing a confluence/cluster of potential SUPPORT in the 866.25-867.50 zone. The next SUPPORT level below that from price action looks like 861.75-862.50.
SUMMARY: RESISTANCE @ 879.75-882 (885 as an extreme, and if penetrated and held, room to run to 900) … SUPPORT @ 866.25-867.50, and 861.75-862.50 … and 850-852 very significant.
Charts posted below.
You deleting my posts, Meat? Sincere..right. Leave it up.
No, didn't delete your posts. After thinking about it and with feedback from others about having a thread put up about an individual trader wasn't necessarily the best thing in the world. It also could lead to potential bashing vs. understanding. Did not desire that ... wasn't the purpose of the thread. So, I requested it be taken down. It's up to you though, if you'd like it back up there, then let the folks at mypivots know. I was sincere and, if you read my posts and response(s), gathered some insight into how and what you're communicating when you post, which I thought important because you post consistently and prolifically across a number of varied threads. It's up to you ... I just don't want to open a door that could potentially create or exacerbate any negative entanglements or attacks from folks.
Btw ... noticed that it's a NR7 (as Joe pointed out) on the ES daily including overnight data. RTH trading is NR4. Either way it's showing range contraction. I looked at Avg. True Range indicator (of short and long lengths) on the daily and we're, for the most part, at the lowest/tightest levels since Dec/Jan.
Also, looking at the ES and SPY ... of the past 17 days, whether the mkt gapped up or down or opened even with prior days close, all but 4 or 5 bars closed above their open, even when including overnight data.
Just some further observations.
Also, looking at the ES and SPY ... of the past 17 days, whether the mkt gapped up or down or opened even with prior days close, all but 4 or 5 bars closed above their open, even when including overnight data.
Just some further observations.
Click image for original size
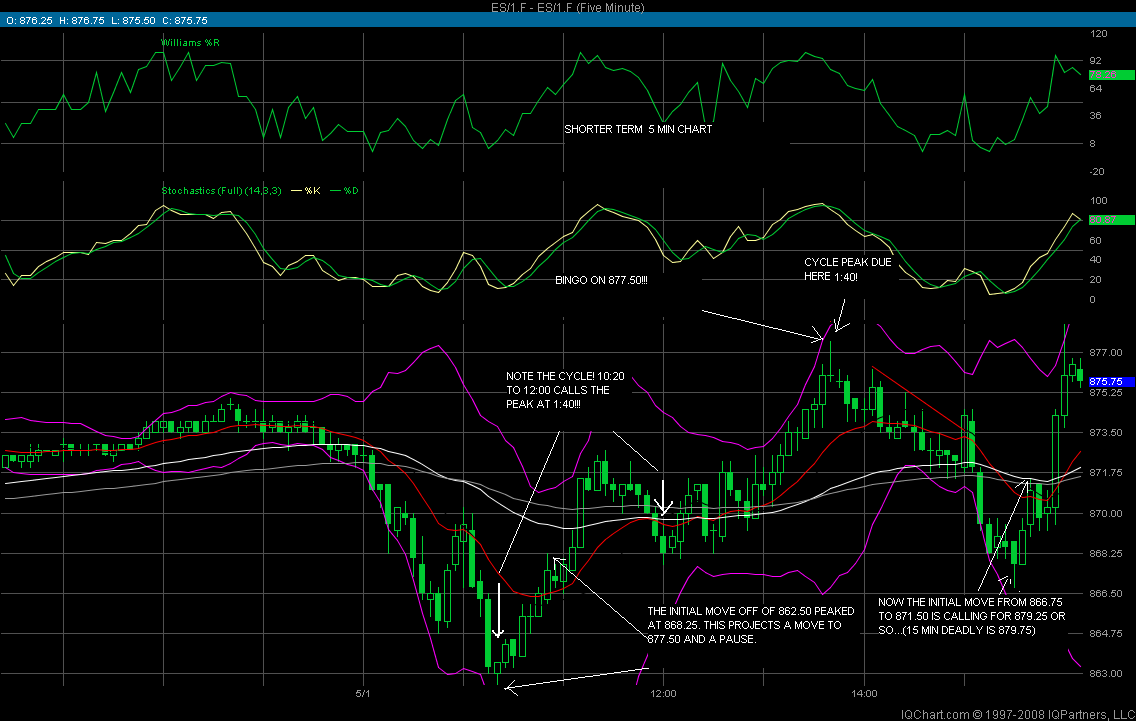
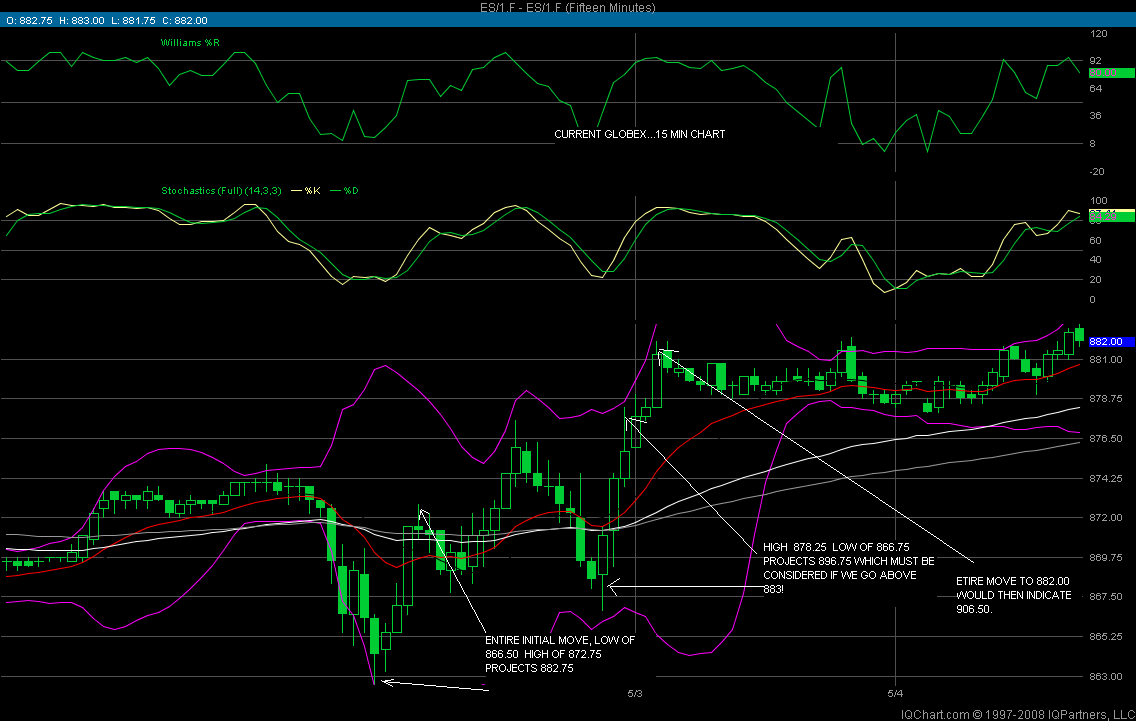
Monkey, ive enjoyed your analysis, especially since it mirrors my own views, from a completely different perpsective. the above and below charts were posted early friday, before the pit open
Click image for original size

It's always Cool Kool, when we arrive at some of the same conclusions yet coming at it from different angles. FYI ES 24-hour data on my Daily and 30 min charts ... RTH for 13 min. The trend channel (and it's midline) on the 30 min chart have held up rather well for a while now on the 24 hour ES data ... actually got a couple of good trades off with their confirmation (both long and short) so far.
When you use the word "projected" throughout the labelling on your 2nd chart ... what method (or methods) are you employing to arrive at a projected price level ... (measured moves, fib work, another indicator etc.)?
When you use the word "projected" throughout the labelling on your 2nd chart ... what method (or methods) are you employing to arrive at a projected price level ... (measured moves, fib work, another indicator etc.)?
fib extentions(kools tools) off of the initial move up or down, Monkey. 2.618 from the start of the initial move. The count of 7 waves is referred to as the 7 wave trend killer!(with apologies to strict Ellioticians!) a phenomenom ive followed for several years.
Click image for original size
9 minutes 30 seconds per corner and retrace intraday cycles mirroring the yearly 30 degree macrocosm and in-line with Elliot five wave, three prime price moves.
3 motive or impulse corners before a 5 wave retrace ABC: 2 hours 53 minutes, times 3, 8 hours 39 minutes.
You could've got an extra point off that 64 projection, and know it was around the corner, following Elliot's 5 waves in relation to the cycle. Not only that you have a movement projection, and know when there's weakness.
That same 64 projection pining for pikes nets 32 points to 96, but I'm leary of the time squared, cycle ending and price rejection factor from 85 & change.
That _should_ be even, Kool. If not FU, kool. lol
Click image for original size
Emini Day Trading /
Daily Notes /
Forecast /
Economic Events /
Search /
Terms and Conditions /
Disclaimer /
Books /
Online Books /
Site Map /
Contact /
Privacy Policy /
Links /
About /
Day Trading Forum /
Investment Calculators /
Pivot Point Calculator /
Market Profile Generator /
Fibonacci Calculator /
Mailing List /
Advertise Here /
Articles /
Financial Terms /
Brokers /
Software /
Holidays /
Stock Split Calendar /
Mortgage Calculator /
Donate
Copyright © 2004-2023, MyPivots. All rights reserved.
Copyright © 2004-2023, MyPivots. All rights reserved.