2 to 1
Wanted to offer the following in the hope that others might review with a constructive eye and, perhaps, conduct additonal backtesting. My technical abilities are limited, so I backtest manually.
The results for the 28 trading days between Apr 2 - May 12 on NQ June show 19 trades. 13 W 164 points 5L 29.75 points 1 BE. Gross of 134.25 points - $2685 before commission
Methodology
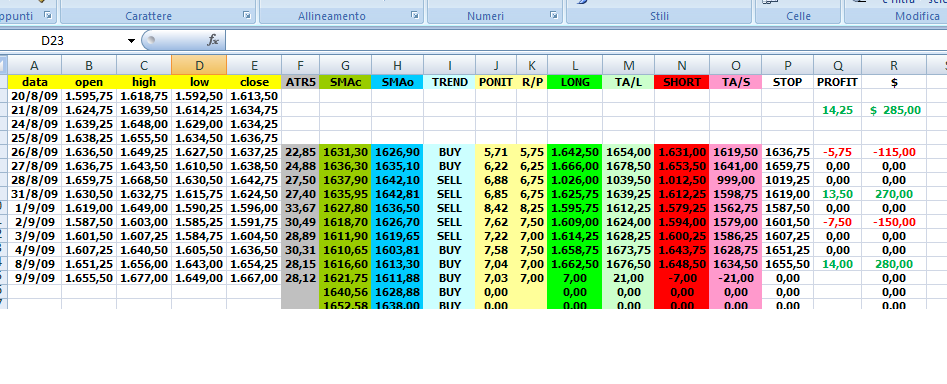
Chart set up: On a day session chart plot the 5 period average true range. Also plot a 5 period simple moving average of both the close and the open. Longs are taken only when the 5 period SMA of the close is above the 5 period SMA of the open. Shorts only when below.
Entries and Exits: If taking longs, add 50% of yesterday's ATR to today's open. This is the entry. Exits are either - a stop order at today's open, limit order at 50% of yesterday's ATR added to today's open, or MOC. For shorts simply reverse.
Having a target that is twice the stop really helped when I manually tested this for the same period as above on the 10 yr note (ZN June). 18 trades were taken. 8 W 83.5 points 10 L 47.5 points Gross of 36.5 points - $1140.62 before commission.
Thanks in advance for your constructive ideas for improvement and any additional backtesting you might undertake.
edit - 25% atr changed to 50%
The results for the 28 trading days between Apr 2 - May 12 on NQ June show 19 trades. 13 W 164 points 5L 29.75 points 1 BE. Gross of 134.25 points - $2685 before commission
Methodology
Chart set up: On a day session chart plot the 5 period average true range. Also plot a 5 period simple moving average of both the close and the open. Longs are taken only when the 5 period SMA of the close is above the 5 period SMA of the open. Shorts only when below.
Entries and Exits: If taking longs, add 50% of yesterday's ATR to today's open. This is the entry. Exits are either - a stop order at today's open, limit order at 50% of yesterday's ATR added to today's open, or MOC. For shorts simply reverse.
Having a target that is twice the stop really helped when I manually tested this for the same period as above on the 10 yr note (ZN June). 18 trades were taken. 8 W 83.5 points 10 L 47.5 points Gross of 36.5 points - $1140.62 before commission.
Thanks in advance for your constructive ideas for improvement and any additional backtesting you might undertake.
edit - 25% atr changed to 50%
Hi Paul,
Thanks for the info. I don't have Ensign but some old software. Your answer was encouraging though, so I'll move forward.
On the testing, before I go too far I want to make sure I have similar results to you.
I have a limitation as I only have H/L/O/C data. Using a short day as an example:
I have assumed that if the trade is initiated AND IF
there is a low at or below our short target we realize that low AND
if not we do get closed out at our OPEN PRICE but at the CLOSE.
This will overstate the profits on "nessie" days. Those that snake up and down. However, on most days we would not expect it to back-track from -25% ATR to open before traveling to the low.
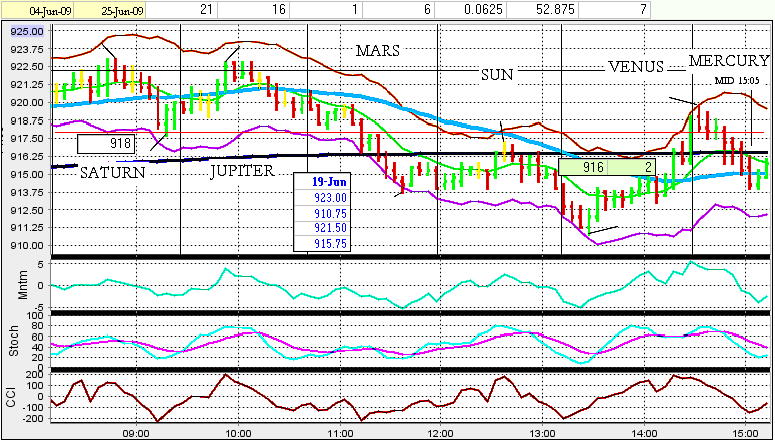
(I have included an example of a "nessie" day -19 June- where my assumptions give you 2 points when you would have had a loss of -25% ATR, I believe.)
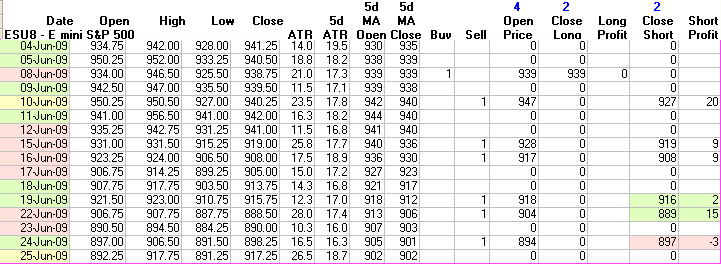
I have enclosed my calculations from 4 June to 25 June on ES. As you are trading your system it should be pretty easy for you to manually check to see if there is a match. There is only 1 long trade and 6 short trades to check.
I have you taking 1 long trade for zero profit and 6 short trades for 52.875 points profit. What were your results for that period?
This file shows the results for the period and one sample day.
Thanks for the info. I don't have Ensign but some old software. Your answer was encouraging though, so I'll move forward.
On the testing, before I go too far I want to make sure I have similar results to you.
I have a limitation as I only have H/L/O/C data. Using a short day as an example:
I have assumed that if the trade is initiated AND IF
there is a low at or below our short target we realize that low AND
if not we do get closed out at our OPEN PRICE but at the CLOSE.
This will overstate the profits on "nessie" days. Those that snake up and down. However, on most days we would not expect it to back-track from -25% ATR to open before traveling to the low.
(I have included an example of a "nessie" day -19 June- where my assumptions give you 2 points when you would have had a loss of -25% ATR, I believe.)
I have enclosed my calculations from 4 June to 25 June on ES. As you are trading your system it should be pretty easy for you to manually check to see if there is a match. There is only 1 long trade and 6 short trades to check.
I have you taking 1 long trade for zero profit and 6 short trades for 52.875 points profit. What were your results for that period?
Click image for original size
This file shows the results for the period and one sample day.
Click image for original size
Here's what I've got. NOt sure how we differ.
6/1/2009 L 4.25
6/2/2009 L (6.00)
6/3/2009 N 0.00
6/4/2009 L 1.00
6/5/2009 N 0.00
6/8/2009 L 0.00
6/9/2009 L (4.75)
6/10/2009 S 8.50
6/11/2009 N 0.00
6/12/2009 N 0.00
6/15/2009 S 8.00
6/16/2009 S 9.50
6/17/2009 S (4.75)
6/18/2009 S (4.25)
6/19/2009 S 2.25
6/22/2009 S 7.50
6/23/2009 S (4.75)
6/24/2009 S (4.00)
6/25/2009 N 0.00
12.50 7W 6L
Hi Paul,
I have gone back and fixed some formula.
The matching is pretty close now (see dif column).
For the June 2 your number is right.
(mine is wrong due to the "nessie factor)
Could you please check your result for 1 June. I checked by hand and still
get a 1.25pt profit (or 1.50 pt depending on how you round the 25% of 5d MA ATR.)
and yours is 4.25.
Thanks
Ian
Click image for original size
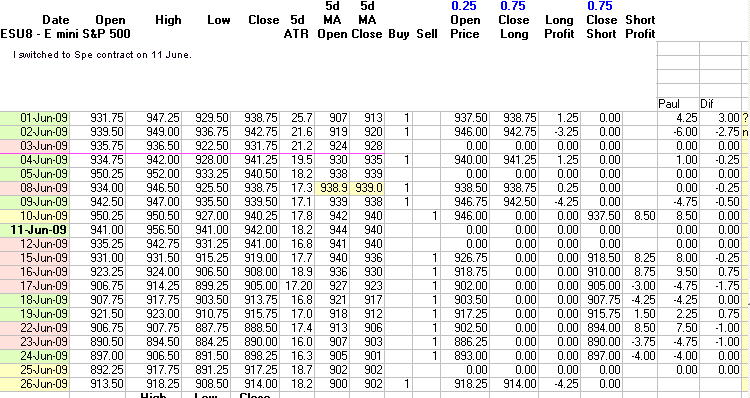
PS I switched from June contract to Sept contract on 11 June.
Hi Paul,
I'm thinking of your strategy in 3 parts:
1. MA Close versus MA Open to determine whether to go long or short
2. the entry price level (25% 5 day MA of ATR)
3. the exit level (75% of 5 day MA of ATR)
What other things have you already considered for part 1,
the long short switch?
Ian
I'm thinking of your strategy in 3 parts:
1. MA Close versus MA Open to determine whether to go long or short
2. the entry price level (25% 5 day MA of ATR)
3. the exit level (75% of 5 day MA of ATR)
What other things have you already considered for part 1,
the long short switch?
Ian
THat's 25% of 5 day atr added or subtracted from the open for entry. TaRGET IS 50% of atr + or - entry for target.
Have looked at +-DMI for direction, MACD, also straght price action..HH, HL, LL, LH etc. NO exhaustive research. Just observation. I find the 2 SMA's of close and open are sensitive and strongly directional. Could experiment with number of periods. I settled on 5 periods through trial and error. But coould be something else will work better.
Wish I could be of more help, Blue.
Best Paul
quote:
Originally posted by blue
Hi Paul,
I'm thinking of your strategy in 3 parts:
1. MA Close versus MA Open to determine whether to go long or short
2. the entry price level (25% 5 day MA of ATR)
3. the exit level (75% of 5 day MA of ATR)
What other things have you already considered for part 1,
the long short switch?
Ian
Hi Paul,
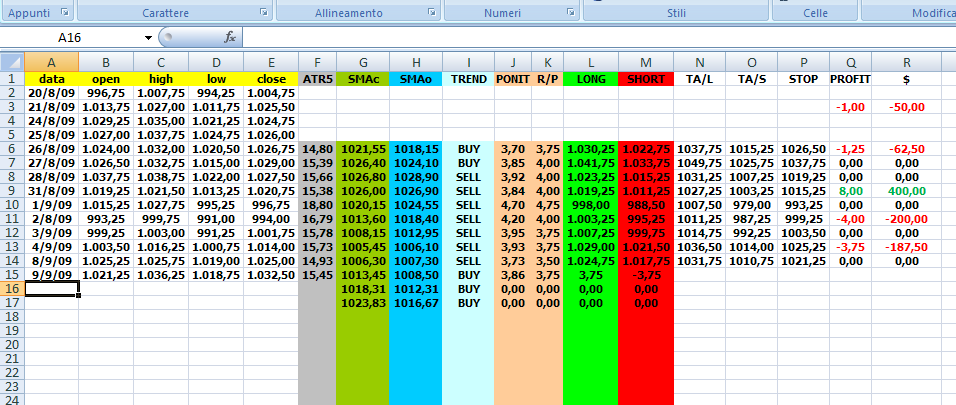
Here's the results of my backtesting with your rules. The results may be a little high as nessie days are not accounted for - though these shouldn't be all that many.
I have segmented the results for different trends, downtrend, sideways, and uptrend.
Here's the results of my backtesting with your rules. The results may be a little high as nessie days are not accounted for - though these shouldn't be all that many.
I have segmented the results for different trends, downtrend, sideways, and uptrend.
Click image for original size

HI Blue:
I'm travelling 'till next week and won't have a chance to review your results in detail until then. WOW...YOU'VE DONE LOTS OF WORK HERE! I do see however that you don't show number of winning trsdes VS losers, just totals. Also how do you define sideways markets as opposed to rising/falling?
Am I reading this right...in June you show 16 Long Trades 9 short trades for a net of 18 points? I assume this is ES.
Will check in again soon as I can.
Best,
Paul
quote:
Originally posted by blue
Hi Paul,
Here's the results of my backtesting with your rules. The results may be a little high as nessie days are not accounted for - though these shouldn't be all that many.
I have segmented the results for different trends, downtrend, sideways, and uptrend.
Click image for original size
quote:
Originally posted by PaulR
HI Blue:
I'm travelling 'till next week and won't have a chance to review your results in detail until then. WOW...YOU'VE DONE LOTS OF WORK HERE!
1. I do see however that you don't show number of winning trsdes VS losers, just totals.
1b. Also how do you define sideways markets as opposed to rising/falling?
2. Am I reading this right...in June you show 16 Long Trades 9 short trades for a net of 18 points? I assume this is ES.
Will check in again soon as I can.
Best,
Paul
Hi Paul,
I noticed a typo on the headers of my columns on the right. "downtrend/profit trades" and "uptrend profit trades" I reversed, but I think you figured this out.
Re2. Yes, that's right if you mean 4 June to 25 June.
Re1. No I didn't show winners and losers (I have one column for profit). If it's important to you I could add some columns to compute that. I really was more interested in looking at the overall profit picture and trying to maximize that.
RE1b. Uptrend, sideways and downtrend were determined by me with trendlines - which is what I use. I wanted to see where your system was most profitable. I attach a picture.
Take care,
blue
Here's a picture. It's a plot of midpoints of the ES. (I switch contract when the main front one is about to expire and volume switches over to the next one.) I hope the boxes are the same - I had to redraw them.
quote:
Originally posted by PAUL9
that's OK daytrading, I just have to make a few more posts. But when I saw that RUSS had 9 I wondered, how many do you need?
hi,
you please check if my levels are correct?
Click image for original size
Click image for original size
Emini Day Trading /
Daily Notes /
Forecast /
Economic Events /
Search /
Terms and Conditions /
Disclaimer /
Books /
Online Books /
Site Map /
Contact /
Privacy Policy /
Links /
About /
Day Trading Forum /
Investment Calculators /
Pivot Point Calculator /
Market Profile Generator /
Fibonacci Calculator /
Mailing List /
Advertise Here /
Articles /
Financial Terms /
Brokers /
Software /
Holidays /
Stock Split Calendar /
Mortgage Calculator /
Donate
Copyright © 2004-2023, MyPivots. All rights reserved.
Copyright © 2004-2023, MyPivots. All rights reserved.