2 to 1
Wanted to offer the following in the hope that others might review with a constructive eye and, perhaps, conduct additonal backtesting. My technical abilities are limited, so I backtest manually.
The results for the 28 trading days between Apr 2 - May 12 on NQ June show 19 trades. 13 W 164 points 5L 29.75 points 1 BE. Gross of 134.25 points - $2685 before commission
Methodology
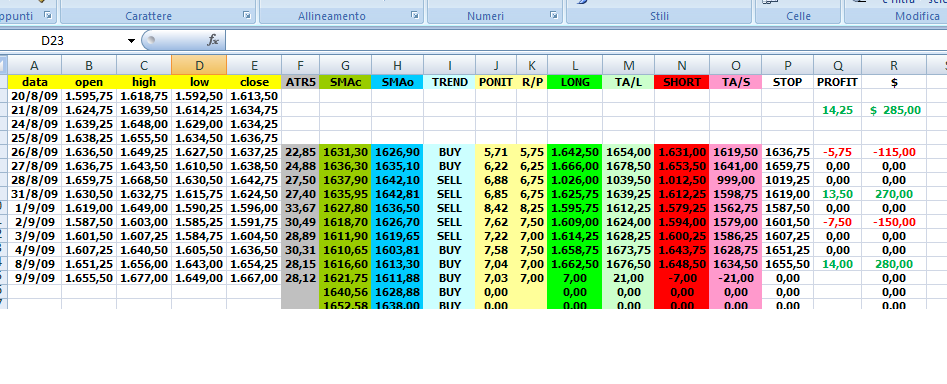
Chart set up: On a day session chart plot the 5 period average true range. Also plot a 5 period simple moving average of both the close and the open. Longs are taken only when the 5 period SMA of the close is above the 5 period SMA of the open. Shorts only when below.
Entries and Exits: If taking longs, add 50% of yesterday's ATR to today's open. This is the entry. Exits are either - a stop order at today's open, limit order at 50% of yesterday's ATR added to today's open, or MOC. For shorts simply reverse.
Having a target that is twice the stop really helped when I manually tested this for the same period as above on the 10 yr note (ZN June). 18 trades were taken. 8 W 83.5 points 10 L 47.5 points Gross of 36.5 points - $1140.62 before commission.
Thanks in advance for your constructive ideas for improvement and any additional backtesting you might undertake.
edit - 25% atr changed to 50%
The results for the 28 trading days between Apr 2 - May 12 on NQ June show 19 trades. 13 W 164 points 5L 29.75 points 1 BE. Gross of 134.25 points - $2685 before commission
Methodology
Chart set up: On a day session chart plot the 5 period average true range. Also plot a 5 period simple moving average of both the close and the open. Longs are taken only when the 5 period SMA of the close is above the 5 period SMA of the open. Shorts only when below.
Entries and Exits: If taking longs, add 50% of yesterday's ATR to today's open. This is the entry. Exits are either - a stop order at today's open, limit order at 50% of yesterday's ATR added to today's open, or MOC. For shorts simply reverse.
Having a target that is twice the stop really helped when I manually tested this for the same period as above on the 10 yr note (ZN June). 18 trades were taken. 8 W 83.5 points 10 L 47.5 points Gross of 36.5 points - $1140.62 before commission.
Thanks in advance for your constructive ideas for improvement and any additional backtesting you might undertake.
edit - 25% atr changed to 50%
Hi Blue:
I like your thinking. You really know how to stimulate some positive ideas. While I am travelling I don't have access to my charts and data, but I did want to respond to your thoughts below.
As for the "what are we trying to accomplish" question, the following was my thinking. An awful lot of my money has been lost trying to interpret and trade what I call the "wiggles" of the day...trading many many times trying to catch a point here or there based on minor price movement, or "wiggles". Whle I liked the "action", I wasn't very good at it. I didn't want to take a position home, so I still had to devise a method that I could day trade and be flat at the end of the day. I'd read some of Mark Fisher, Tom DeMark and even back to Welles Wilder and based on some of their various approaches came up with this "No Wiggles" approach that attempts to catch 50% of the 5 day ATR while risking only 25% of the 5 day ATR. I belive it is absolutely imperative to at least target that win/loss ratio, and that has served well when during sideways markets the wins might get down to 50% or even lower. On those occasions that 2 to 1 ratio keeps one in the black, or results in a minor loss overall. So the target and stop make up 75% of the range...the other 25% I leave as homage to the trading gods..hehe. Actually, I figure some price movement will go against you and leave room for that. The key then is when and how to enter. Yesterday's close is certainly a reasonable point of comparison, but I have heard too many times to ignore that the "pros" focus on price relative to the open of the day. It is a more recent stake in the ground that many follow. However, I do like your idea of averaging the amount price moves from the open in a direction opposite from the trend as a means of entering earlier and capturing a larger amount of the move with a stop based on that average or 25% of the 5 say ATR from your point of entry.
Sorry, have to run.
Best to you.
PaulR
quote:
Originally posted by blue
Hi Paul,
One of your posts mentioned s. th like
"when I find one of these things it works for a while and then falls apart" and you asked about improvements.
---------
Here are my intial thoughts on a system and tesing it.
First I ask
"What is this system trying to capture?"
"What is the statement or hypothesis?"
Using your system as an example, the general phasing of it might be s. th like:
In a "down day" if the price falls below x then short and close the short at y.
If it doesn't get to y stop yourself out at z or the day's close.
So we have:
"down day"
x
y
z
I was thinking about the definition of "down day"
A. The most usual is when today's close is < yest close.
B. Another might be today's midpoint < yesterday's midpoint.
C. But for your system we mean a day when
the low < the open (by a good margin).
So the first thing I would look at is our rule for "down day"
effective at identifying "C". In other words is
MA Close - MA Open a good predictor of when
the low will be less than the open by enough to get to y.
(and without a "nessie stop out")
(A "nessie stop out" would be price falls to our trigger x and then rises to our
stop-loss z before falling to y.
With numbers:
25%of MA atr at 4points, Open= 915
x= 915-4=912
y=915-8 = 907
z= 915+4 = 916
So a nessie stop out is opening at 915, falling to 912 or less but not as far as 907,
climbing back to 916 where we stop out and then falling to 907 where we would have
taken a profit if we had of still been in the trade.)
So is MA close vs MA open effective at identifying "C" type down days?
We are going to short (and not going to go long based on it).
It would seem to me that:
1. In strong down periods you want to short every day.
2. The best price to short is probably the open or above the open
3. The best price to close is the low of the day
- since you don't know what the low is you could estimate with the average daily range
subtracted from the high. When you get there you can close or use a trailing stop or
stay with it until an indicator shows the end of the fall.
So for a downtrend we would look at the average amt the high is above the open.
If this is very little eg less than 4 points on a average 25 point range {@abs(h-l)} then we
would just sell at open. If not, then we can find tune our sell price to the average above open
and then when you get or use a trailing buy or
stay with it until an indicator shows the end of the rise.
All of this is if you want to have only a day trade.
Just some ideas.
blue
Hi Paul,
Thank-you for your kind words and for sharing your thoughts.
[An awful lot of my money has been lost trying to interpret and trade what I call the "wiggles" of the day...trading many many times trying to catch a point here or there based on minor price movement, or "wiggles". Whle I liked the "action", I wasn't very good at it. I didn't want to take a position home, so I still had to devise a method that I could day trade and be flat at the end of the day.]
I understand what you mean. I feel that because the pros understand us (the public) so well they are wonderful and sucking us in. Sometimes they might run a stop area 2 times or 3 times or sometimes they touch and run and sometimes reverse short start going the other way and then when we panic and jump on-board then reverse the train back to our original stop throw us off and then run again.
So I definitely like the idea of a simple system. For myself I like to add in some flexibility on the "outside of hard rules" as long as the strength of the hard rules isn't compromised.
Back to your system, I would guess that in sideways trends what you are really trying to guess is whether tomorrow will be a wide-ranging day and how wide. Perhaps up or down doesn't matter. You take either side as it moves in that direction.
It would of course be nice to know tommorrow's direction but I haven't yet found a way to guess that with much more than about 55% accuracy.
all the best,
blue
Hi Blue:
Here are my set ups for today 7/8/09
ES Short Entry=open-4 Target=entry-8. Stop=Open or MOC
NQ Short Entry=open-6.75. Target=entry-13.50 Stop=Open or MOC
ZN Long Entry=open+4. Target=entry+8 Stop=open or MOC
Here are my set ups for today 7/8/09
ES Short Entry=open-4 Target=entry-8. Stop=Open or MOC
NQ Short Entry=open-6.75. Target=entry-13.50 Stop=Open or MOC
ZN Long Entry=open+4. Target=entry+8 Stop=open or MOC
Not a bad day. ES +$400 NQ -$135 ZN +$250. Net +$515 on 1 contract each (exclusive of commissions)
quote:
Originally posted by PaulR
Hi Blue:
Here are my set ups for today 7/8/09
ES Short Entry=open-4 Target=entry-8. Stop=Open or MOC
NQ Short Entry=open-6.75. Target=entry-13.50 Stop=Open or MOC
ZN Long Entry=open+4. Target=entry+8 Stop=open or MOC
quote:
Originally posted by PaulR
Not a bad day. ES +$400 NQ -$135 ZN +$250. Net +$515 on 1 contract each (exclusive of commissions)
Good Work Paul!
Hi Paul,
I hope things are going well.
Thanks for posting your strategy - it has motivated me to think about a mechanical strategy I can back test.
I watched this video summary of a free e-book:
http://www.rockwelltrading.com/free-ebook-cliffsnotes
(30 minutes.). I have downloaded the book but haven't read it yet (296 pages).
It reinforced a conversation that I had with a friend - and things I have read - trade in line with your personality.
Thanks, Blue. I'll check it out.
Things are going well. I've found that by trading this approach on several instruments at the same time (diversifying) the overall results are steadier.
Hope all is well with you.
Things are going well. I've found that by trading this approach on several instruments at the same time (diversifying) the overall results are steadier.
Hope all is well with you.
Hello PaulR,
Do you include the overnight session in the ATR or only the day session?
Also, what is the ZN?
Is that the 10-Year Note Future?
Thanks,
Russ
Do you include the overnight session in the ATR or only the day session?
Also, what is the ZN?
Is that the 10-Year Note Future?
Thanks,
Russ
Hi Russ:
I don't include the overnight session. Just regular trading hours. Yes, ZN is 10 year note.
PaulR
I don't include the overnight session. Just regular trading hours. Yes, ZN is 10 year note.
PaulR
has anyone programmed this as a strategy in tradestation yet? the final acid test is to see its performance for the last 2 years at least.
quote:
Originally posted by PAUL9
that's OK daytrading, I just have to make a few more posts. But when I saw that RUSS had 9 I wondered, how many do you need?
hi,
you please check if my levels are correct?
Click image for original size
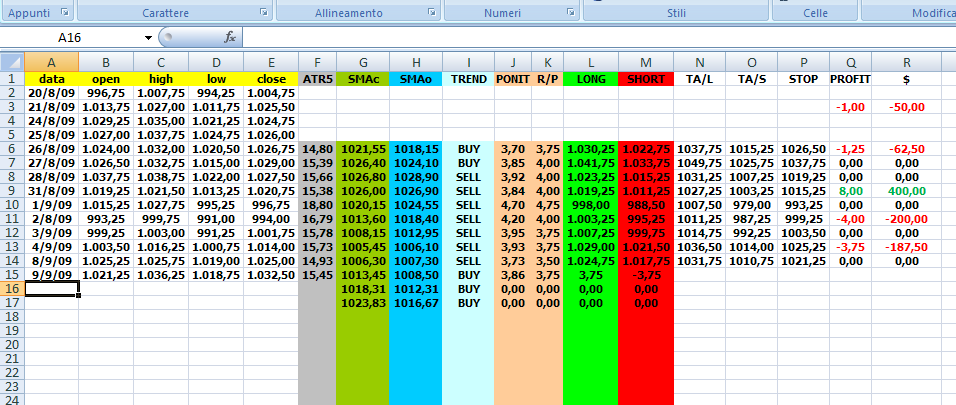
Click image for original size
Emini Day Trading /
Daily Notes /
Forecast /
Economic Events /
Search /
Terms and Conditions /
Disclaimer /
Books /
Online Books /
Site Map /
Contact /
Privacy Policy /
Links /
About /
Day Trading Forum /
Investment Calculators /
Pivot Point Calculator /
Market Profile Generator /
Fibonacci Calculator /
Mailing List /
Advertise Here /
Articles /
Financial Terms /
Brokers /
Software /
Holidays /
Stock Split Calendar /
Mortgage Calculator /
Donate
Copyright © 2004-2023, MyPivots. All rights reserved.
Copyright © 2004-2023, MyPivots. All rights reserved.