2 to 1
Wanted to offer the following in the hope that others might review with a constructive eye and, perhaps, conduct additonal backtesting. My technical abilities are limited, so I backtest manually.
The results for the 28 trading days between Apr 2 - May 12 on NQ June show 19 trades. 13 W 164 points 5L 29.75 points 1 BE. Gross of 134.25 points - $2685 before commission
Methodology
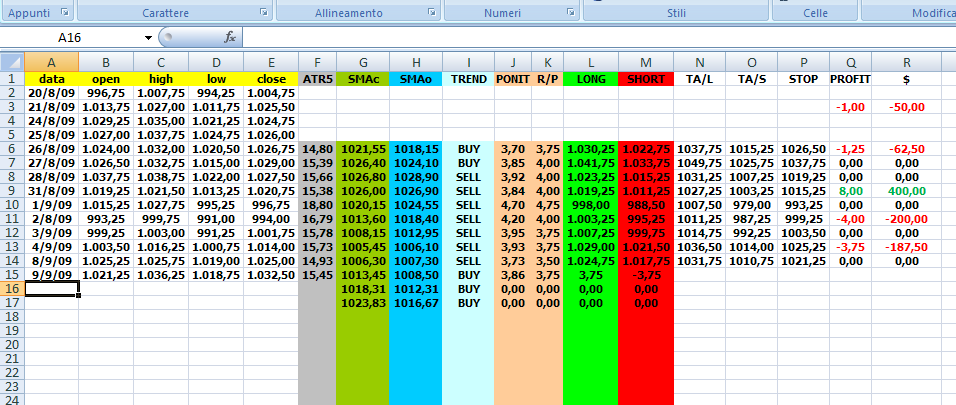
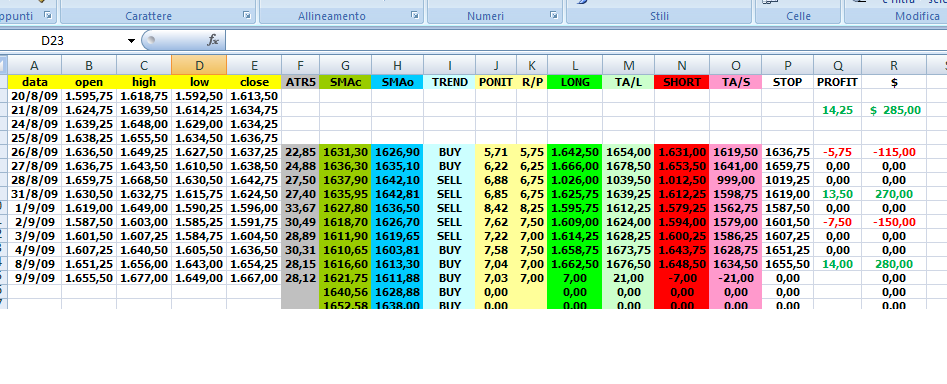
Chart set up: On a day session chart plot the 5 period average true range. Also plot a 5 period simple moving average of both the close and the open. Longs are taken only when the 5 period SMA of the close is above the 5 period SMA of the open. Shorts only when below.
Entries and Exits: If taking longs, add 50% of yesterday's ATR to today's open. This is the entry. Exits are either - a stop order at today's open, limit order at 50% of yesterday's ATR added to today's open, or MOC. For shorts simply reverse.
Having a target that is twice the stop really helped when I manually tested this for the same period as above on the 10 yr note (ZN June). 18 trades were taken. 8 W 83.5 points 10 L 47.5 points Gross of 36.5 points - $1140.62 before commission.
Thanks in advance for your constructive ideas for improvement and any additional backtesting you might undertake.
edit - 25% atr changed to 50%
The results for the 28 trading days between Apr 2 - May 12 on NQ June show 19 trades. 13 W 164 points 5L 29.75 points 1 BE. Gross of 134.25 points - $2685 before commission
Methodology
Chart set up: On a day session chart plot the 5 period average true range. Also plot a 5 period simple moving average of both the close and the open. Longs are taken only when the 5 period SMA of the close is above the 5 period SMA of the open. Shorts only when below.
Entries and Exits: If taking longs, add 50% of yesterday's ATR to today's open. This is the entry. Exits are either - a stop order at today's open, limit order at 50% of yesterday's ATR added to today's open, or MOC. For shorts simply reverse.
Having a target that is twice the stop really helped when I manually tested this for the same period as above on the 10 yr note (ZN June). 18 trades were taken. 8 W 83.5 points 10 L 47.5 points Gross of 36.5 points - $1140.62 before commission.
Thanks in advance for your constructive ideas for improvement and any additional backtesting you might undertake.
edit - 25% atr changed to 50%
Hi Miller
I am intersted in sharing cost of strategy on Ninja.
Can you please inform me the details.
By the way, thanks a lot Paul for sharing 2 to 1.
Best Regards
Parvesh
P
I am intersted in sharing cost of strategy on Ninja.
Can you please inform me the details.
By the way, thanks a lot Paul for sharing 2 to 1.
Best Regards
Parvesh
P
quote:
Originally posted by Miller
Hi All:
After observing Paul's method and taking a glace at some other markets to see if it may work there also, I went ahead and got some quotes from various programmers to program this strategy for backtesting on the Ninja platform. (Paul - I hope you dont mind!).
I have not decided as of yet to have it done, but if anyone who uses Ninja is interested in sharing the cost and use of the strategy with me, that would be fantastic.
Love the forum.
Regards,
Miller
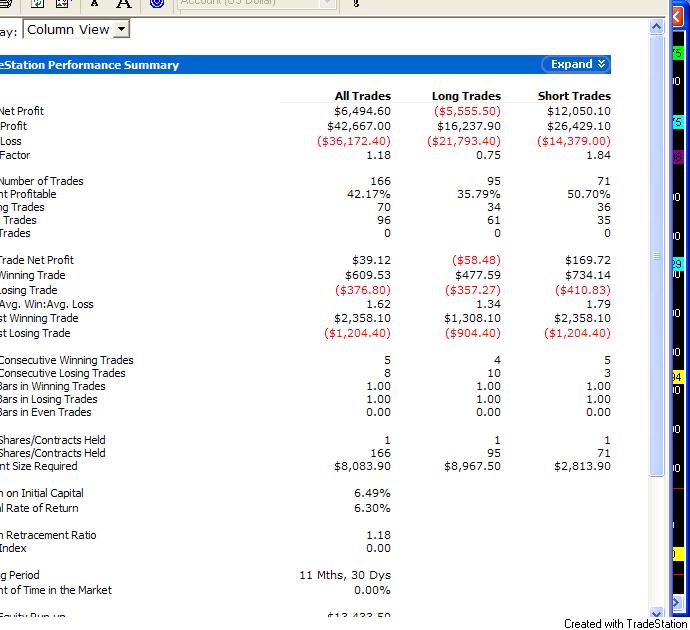
I ran the strategy from 7/27/07 - 7/24/09.
(this is the first time that I have upoladed a file.
If there are any problems , please let me know.
Click image for original size
Click image for original size
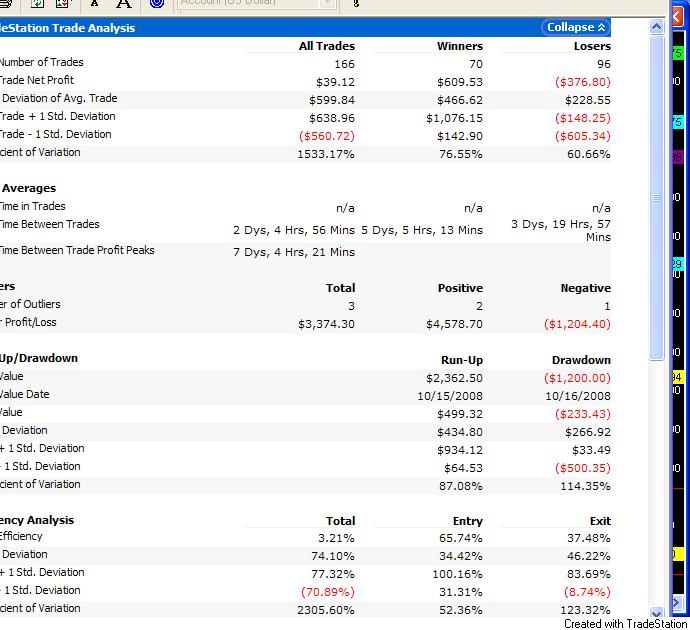
Click image for original size

Nice work John. Thanks for doing that. Wish I had your skills. Also wish the results were better. Not a very good result for 2 years worth of trading.
The results show the largest winning trade yielding $2,358.10. That's 47+ ES points. That means the prior day's 5 day ATR would have to have been over 94 points! We did have a few of those back in Oct '08.
Just as a point of comparison, here's what my trades looked like for the same 6/4/09 - 7/24/09 period you showed in that last spread sheet.
Date L/S Day +/- Cumulative $
6/4/2009 L 1.00 1.00 $50.00
6/5/2009 N 0.00 1.00 $50.00
6/8/2009 L 0.00 1.00 $50.00
6/9/2009 L (4.75) (3.75) $(187.50)
6/10/2009 S 8.50 4.75 $237.50
6/11/2009 N 0.00 4.75 $237.50
6/12/2009 N 0.00 4.75 $237.50
6/15/2009 S 8.00 12.75 $637.50
6/16/2009 S 9.50 22.25 $1,112.50
6/17/2009 S (4.75) 17.50 $875.00
6/18/2009 S (4.25) 13.25 $662.50
6/19/2009 S 2.25 15.50 $775.00
6/22/2009 S 7.50 23.00 $1,150.00
6/23/2009 S (4.75) 18.25 $912.50
6/24/2009 S (4.00) 14.25 $712.50
6/25/2009 N 0.00 14.25 $712.50
6/26/2009 N 0.00 14.25 $712.50
6/29/2009 L 1.00 15.25 $762.50
6/30/2009 N 0.00 15.25 $762.50
7/1/2009 L (4.00) 11.25 $562.50
7/2/2009 N 0.00 11.25 $562.50
7/3/2009 N 0.00 11.25 $562.50
7/6/2009 N 0.00 11.25 $562.50
7/7/2009 S 7.00 18.25 $912.50
7/8/2009 S 8.00 26.25 $1,312.50
7/9/2009 S (4.25) 22.00 $1,100.00
7/10/2009 S (3.75) 18.25 $912.50
7/13/2009 S (3.50) 14.75 $737.50
7/14/2009 S (4.50) 10.25 $512.50
7/15/2009 L 8.00 18.25 $912.50
7/16/2009 L (5.00) 13.25 $662.50
7/17/2009 N 0.00 13.25 $662.50
7/20/2009 N 0.00 13.25 $662.50
7/21/2009 N 0.00 13.25 $662.50
7/22/2009 L 7.50 20.75 $1,037.50
7/23/2009 L 7.00 27.75 $1,387.50
7/24/2009 L 2.50 30.25 $1,512.50
13 W 11 L
Our numbers are different. Don't know why. Will try to figure it out.
Take care.
quote:
Originally posted by jbux
Thanks for the offer. Unfortunately, I'm not sure I'd understand it. Perhaps someone who is more fmailiar with that language will find it helpful and be good enough to translate it. Will be happy to look it over though. Always willing to learn.
Thanks, John.
PaulR,
Would you like me to post the code that I am using on TS ?
JB
John:
After ruminating a bit over the backtest you ran, I've had some additional thoughts that I'd like to share. You may not be aware that I am trading this approach on 3 instruments..ES, NQ and ZN. I find that on some days when one or the other results in a loss, one or the other also gives me a win. This often mitigates the loss and turns a profit for the day. Since you already have the code written, would you mind running the same backtest for the same period that you ran for ES, on NQ and ZN?
One more thing. I was wondering if using the 5 day "Range" rather than the 5 day "Average True Range" might offer better results. The reason for that thought is that a while ago I started tracking this approach against corn and some other commodities. But they seemed to have many more and many larger gaps day to day. Since the ATR calculation reflects those gaps, I found that the stops and targets were much larger than the intraday action might support. Could using intraday range instead of ATR give us better results? Would it be possible for you to test that?
John, if you, or anyone else have any thoughts for improving these results they would be appreciated.
Thanks, again, John for all your work. Best to all.
quote:
Originally posted by myptofvu
Anyone know why exchange fees would be different?
When I looked a the link above http://www.tradestation.com/brokerage/commissions.shtm posted by blue they listed $1.14 in exchange fees for Emini contracts.
The statements I receive from my broker show the fees somewhere around 0.38 cents.
With commissions and fees my round turn is $3.23 per ES contract and that's not a volume discount nor am I an exchange member or lease a seat or anything else, but I'm just confused as to how exchange fees can differ like that.
So your round turn is $3.23 and theirs is $4.70, is that correct?
{My IB is $5.00 per roundturn}
Paul,
The strategy uses ATR but it can easily be changed to avg Range instead. I also have added inputs that allow you to adjust the percentages of the ATR... for ex. instead of using 25% and 50% you can use 17% and 40% etc... allowing you to optimize the system. I'll backtest using Range when I get time later today.And yes I am aware that you have been using this method for other products. I have results for those products also ... including Crude(QM) and Yen(JY)
Are the results that you posted using live or actual trading, or just looking back at previous daily ranges? The reason that I ask is that my strategy results will dramatically improve if I don't use "Look Inside the Bar" for backtesting purposes.
Thanks for posting your strategy ideas.
John
That's great, John. Will look forward to seeing the results on the other products and any differences between ATR and Average Range.
The results I posted are live trading numbers.
When you say "Look inside the Bar", I assume that means tracking intraday price movement VS a static daily bar? I know that looking back with just daily bars will result in artificially inflated results.
Wish I could be of more assistance in coding this stuff or running the tests. Thanks, again John
quote:
Originally posted by PAUL9
that's OK daytrading, I just have to make a few more posts. But when I saw that RUSS had 9 I wondered, how many do you need?
hi,
you please check if my levels are correct?
Click image for original size
Click image for original size
Emini Day Trading /
Daily Notes /
Forecast /
Economic Events /
Search /
Terms and Conditions /
Disclaimer /
Books /
Online Books /
Site Map /
Contact /
Privacy Policy /
Links /
About /
Day Trading Forum /
Investment Calculators /
Pivot Point Calculator /
Market Profile Generator /
Fibonacci Calculator /
Mailing List /
Advertise Here /
Articles /
Financial Terms /
Brokers /
Software /
Holidays /
Stock Split Calendar /
Mortgage Calculator /
Donate
Copyright © 2004-2023, MyPivots. All rights reserved.
Copyright © 2004-2023, MyPivots. All rights reserved.