ES Charts/Analysis for 5/13
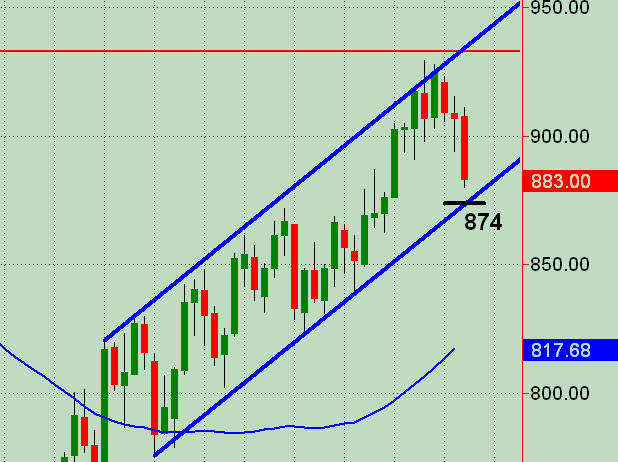
Posting 2 charts here ... a daily and 13 min. The daily has an Andrew's Pitchfork in black with price reacting off the midline today. Also, the blue lines are a parallel trend channel that's still intact and containing price action.
The 13 min chart simply has price action levels that could potentially function as support or resistance at the horizontal blue lined prices.
Would like to see others post charts and any additional analysis here coming into the trading day on Wednesday 5/12. And always open to feedback on what I'm posting.
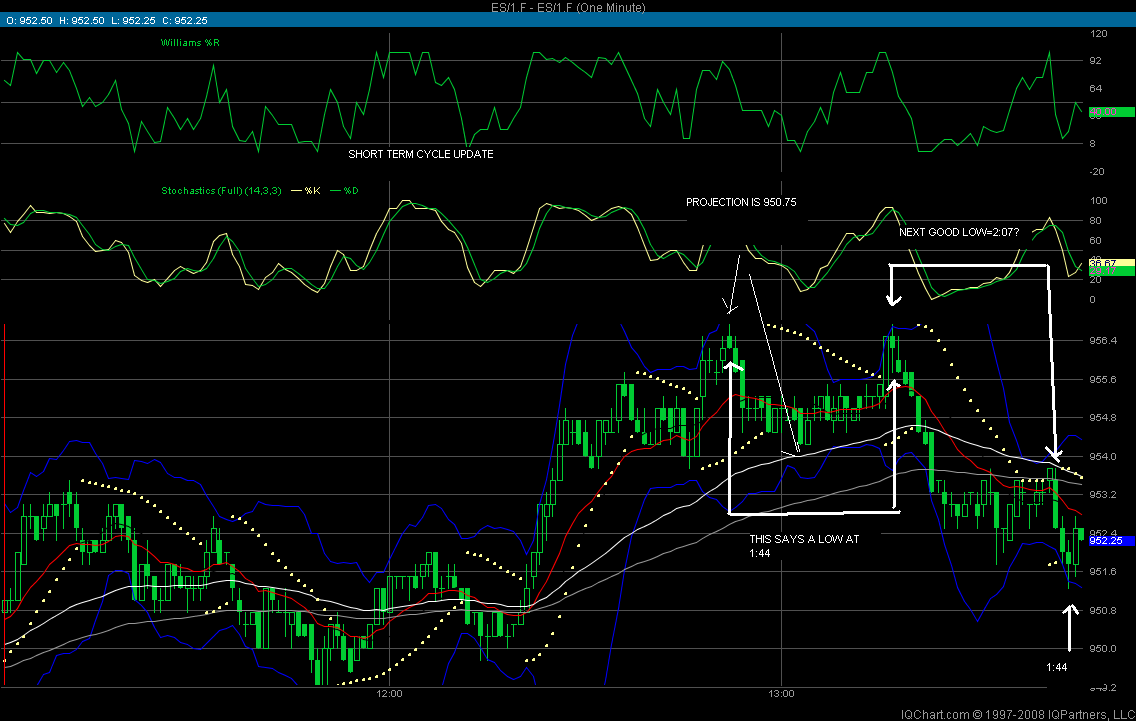
bingo again ...894.25 achieved right at the 9:29 expected mini peak
by the way, Monkey, did u get my e-mail?
Click image for original size
...
Good market analysis and trading this morning, Kool. Yeah, got your email ... think I posted something earlier to you about it. I also noodled through your Kools Tools forum a bit. Really interesting approach. I like the short term time frame charts as I'm a scalper by nature. Your cycle projections seem pretty straightforward but am sure there are some nuances to it that allow for its most effective use. In other words, with all the swing highs/lows, I'm sure there are some not to be used and others that are (and some that are better than others). And the projections aren't quite as clear to me as to which place/swing etc. on the chart a projection is initiated from ... and which projection multiplier you use. I know you'd mentioned your main one in another post to me but wonder if/when/where others are employed (or not). Your chart analysis and commentary are a good way for communicating what you're seeing based on your time(cycle) / projection(price) / plus indicators. Wish I had a better grasp of the nuances/details (alluded to above) to understanding your swing choices etc. to more accurately understand what you're seeing. I will say, you seem to be spot on continually and consistently. Good stuff Kool!!!
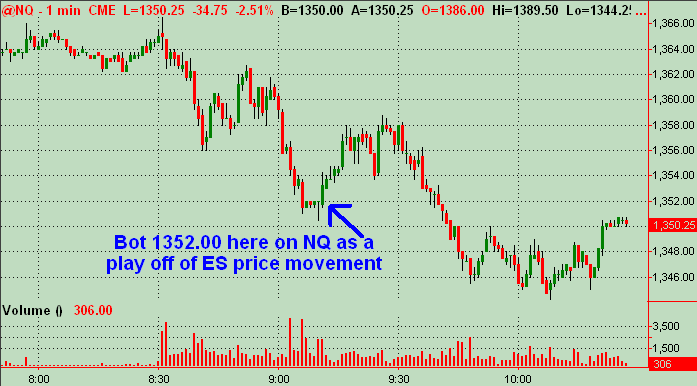
Missed the ES long in the area you initially bot this morning ... I had a price zone of support around 889 but missed any trade. I was trying to figure out where BruceM's (pitbull) open minus Xpoint prices were. Ended up juggling too many things at once. And I misread my 1min chart and looked at 7:30cst instead of 8:30 so messed up the calcs anyway. Like I said too much going on and hopping around from chart to chart and having to actually "think" !?! Go figger! Anyway, I did get a trade off in the NQ's playing it off of ES price movement looking at the 5min down to 1min charts. ES was beginning to rally and looked for a follow up pop (or better) based on the pattern on the NQ 1min chart that I've posted below.
Mkt trading at 886 area right now ... my next potential support level of significance below that is around 879-880 initially.
Mkt trading at 886 area right now ... my next potential support level of significance below that is around 879-880 initially.
Click image for original size
Daily ES chart with trend channel lower line price ... if it gets down in that area. So far, ES has bounced off of the 880 area I listed at the end of prior post.
Click image for original size
Bot NQ 1344.25 w/43.00 tight tight stop looking for a scalp of at least 3-5 points (small size that'll leave just a couple of runners)
Well, that was quick and interesting. Mkt spiked and I moved stop on position up to 45 and got hit PDQ ... +3 ticks??? Bleh!
Emini Day Trading /
Daily Notes /
Forecast /
Economic Events /
Search /
Terms and Conditions /
Disclaimer /
Books /
Online Books /
Site Map /
Contact /
Privacy Policy /
Links /
About /
Day Trading Forum /
Investment Calculators /
Pivot Point Calculator /
Market Profile Generator /
Fibonacci Calculator /
Mailing List /
Advertise Here /
Articles /
Financial Terms /
Brokers /
Software /
Holidays /
Stock Split Calendar /
Mortgage Calculator /
Donate
Copyright © 2004-2023, MyPivots. All rights reserved.
Copyright © 2004-2023, MyPivots. All rights reserved.