MTP applied with Ninjatrader and TTT
Hi everyone, I was asked on the Ninjatrader support forum to show how I was using MTPredictor with Ninjatrader and TTT method.
I will show just a few examples on this forum as it is easier for me that way, of course I won't show all the indicators I use with these signals as I have spent so many hours researching that I don't feel like giving them away.
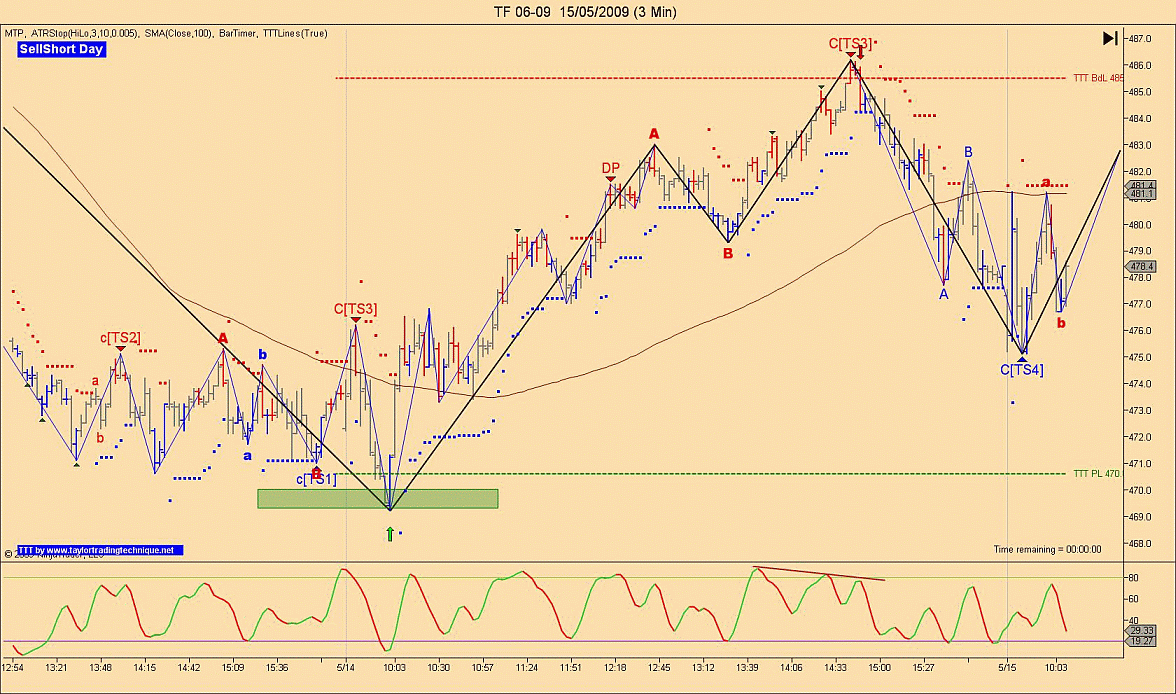
So I will start with the TF Thursday May 14th. First from Richard's TTT e-mail I had this:
to start with Today was a Sell day(Wednesday). We didn't get much of a rally. ES and YM gapped down below the Buy day low and did rally to these lows, while TF and NQ opened above the Buy day low and dropped never looking back. TVGR was in effect all day.
Tomorrow (Thursday)is SS day. We do have 85% chance of getting at least back to the Buy day lows.
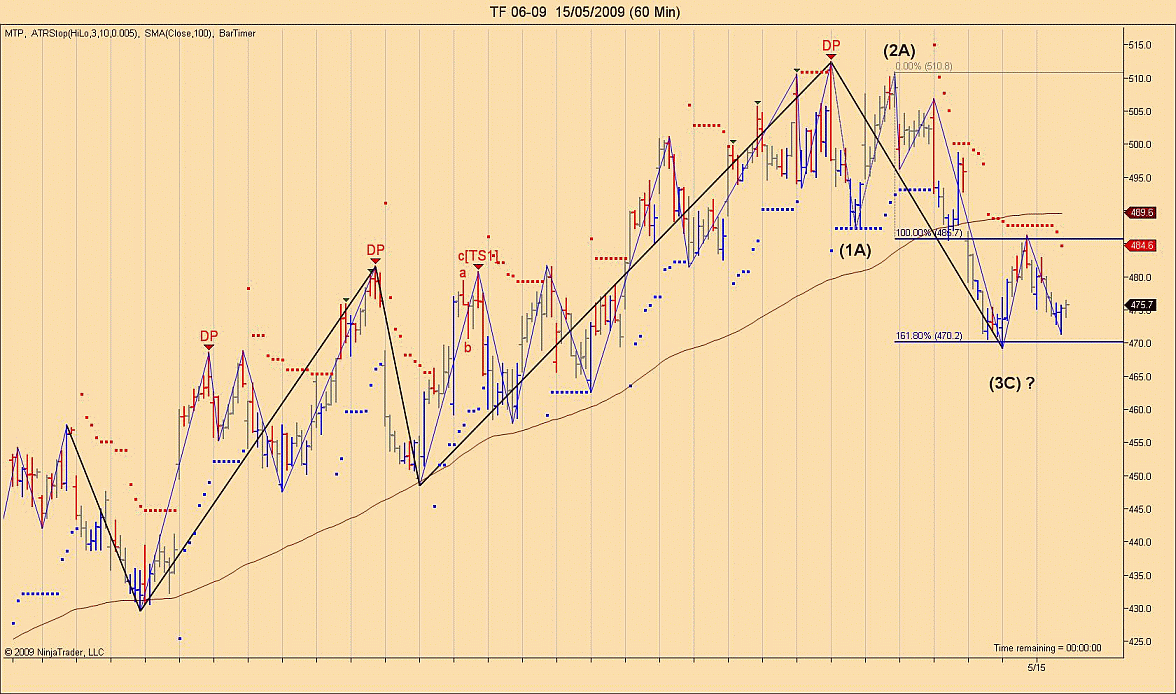
So from the opening TF opened at a manual DP level, based on the odds of going back to the buy day low I was a buyer at this level you could say takes some guts to do that but what about if we look at the 60 min chart and see that we are also at the 162% extension level from wave 1 and 2, hum this makes it much more interesting don't you think.
Then around 14:30 we reached the buy day low so it was now time to sell TF as we also had stochastic divergence
The next day (Friday) was a buy day and once again here's what I had in Richard's TTT e-mail:
Hi All
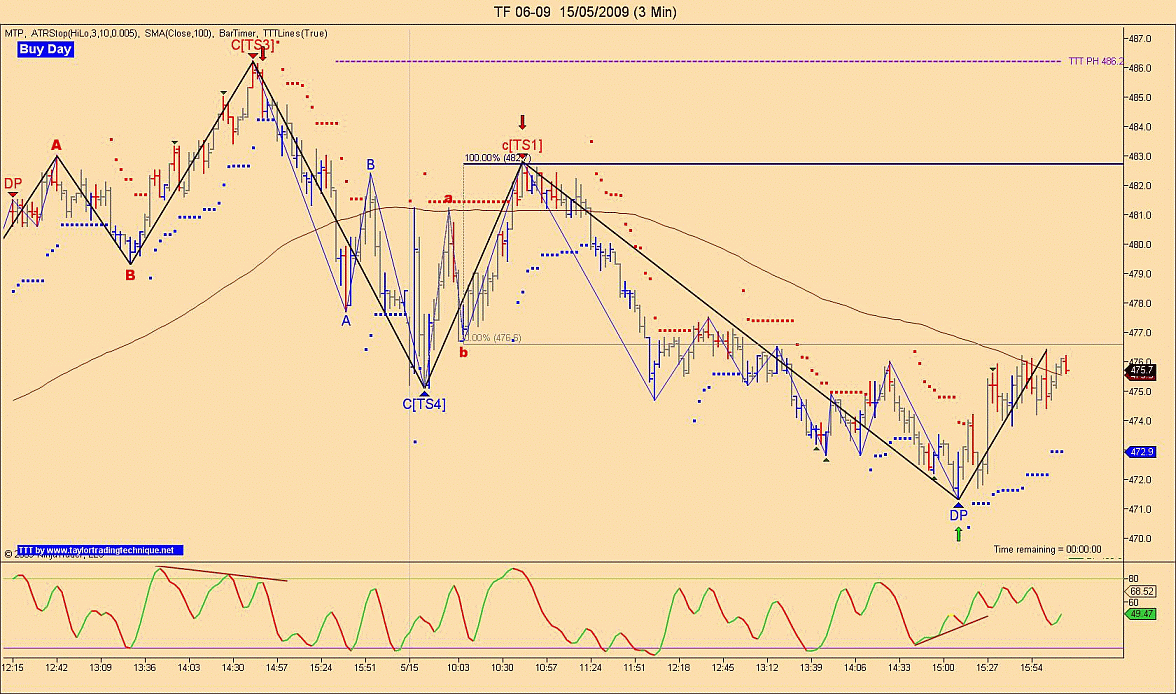
Today was a SS day. All the instruments made it back to the Buy day low and as soon as TF made it across they all reversed.
Tomorrow is Buy Day. We should expect a decline on a Buy day.
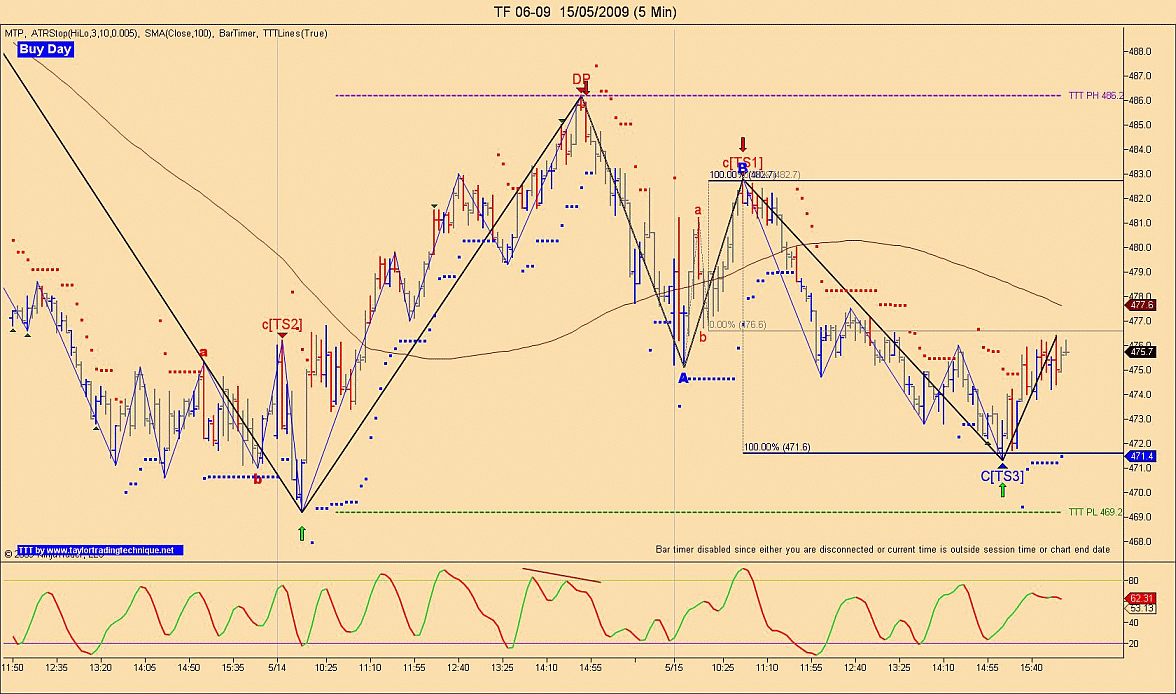
So once again based from that I was more a seller then a buyer, so I waited for markets to give me a sell signal and around 10:42 we had a nice TS1 signal on 3 min with wave C = wave A (100%) at 482.7, from there market went down to about 471 where we had a nice automatic DP with stochastic divergence and a possible TS3, then on the 5 min we had once again wave C = wave A at 471.6 (actual low 471.3) so this was another low risk trade to initiate as we had made a good part of the decline that was supposed to unfold.
I hope these charts will help you understand better how I use MTP,TTT and some indicators to increase my odds of winning when daytrading.
Nice charts and analysis ... but the following comment you posted frustrates my understanding of your analysis: "I will show just a few examples on this forum as it is easier for me that way, of course I won't show all the indicators I use with these signals as I have spent so many hours researching that I don't feel like giving them away."
To the point, if you're effectively "black/gray boxing" your indicators and analysis here ... unless you're going to make specific trading calls in advance, based on your method as shown on your charts, how can WE learn and share back and forth in this environment in ways the we all will learn ... and hopefully improve our individual trading??
And please don't take this as a negative, Larry22. I went through the charts and commentary several times. Call me a simpleton, but I'm just trying to understand if I need to buy certain software and indicators that you have on your charts ... or if you're going to be calling out potential price levels and/or trades in advance ... or if I should just do my best to understand all the lines and labels with your commentary over time so that I truly have a decent understanding of what you're trying to share ... so that I can implement it effectively in my own trading.
Let me know, and Thanks!
MM
Hi MonkeyMeat, I am by no mean selling anything here, all I am trying to show is part of the things I use to daytrade.
1) I must say that my trading is mostly based on EW analysis and that is not something easy to the average traders some counts are very obvious and others are much more complex and EW is still something that can't be used alone for trading.
2) Because of that I have looked for more tools that could help me finding the trend of the day so I came up with the Taylor's technique that Richard has brought to the computer age.
3) I have posted before some charts with OB or OS conditions I like the settings I use but I encourage people to test their owns as they might find some that are even better then the ones I use.
4) I understand your point of view about the fact that I am not revealing everything but you need to understand that I have done lots of research to find these as I have tested about every Ninjatrader indicators that has been posted on the support forum and with the help of a very good friend we modified some to obtain what I was looking for.
So in conclusion I just wanted to share part of my work as someone asked for it on the Ninja Forum and it was easier to do it here.
Larry was responding to my question on Ninja Forum, and I appreciate info and will decide if the software can help me. The TTT lines look interesting too.
BTW, I haven't found any indicators alone that really helped my trading and I have gone through plenty.
BTW, I haven't found any indicators alone that really helped my trading and I have gone through plenty.
quote:
Originally posted by jcflaw
Larry was responding to my question on Ninja Forum, and I appreciate info and will decide if the software can help me. The TTT lines look interesting too.
BTW, I haven't found any indicators alone that really helped my trading and I have gone through plenty.
That's the thing you can't use an indicator alone you need to apply what I now call a package (2 or 3 indicators found on Ninja forum that once combined rarely fail to provide a minimum reaction) so this increase your odds of winning quite a lot when you have MTP signals or when you are at some Fibs or TTT levels.
P.S If I have been able to find them I don't see why others couldn't.
While from your posts - you like an indicator that I have used = MACDbb.
quote:
Originally posted by jcflaw
While from your posts - you like an indicator that I have used = MACDbb.
Yes but I found out that stochastic was better on lower time frame, I also use different settings depending of the time frame, another thing I discovered over the time. BTW on the MTP blog you will see the stochastic settings that I use as this was discovered by a member there d day. So even Steve Griffith uses it on some of his trades that he posts.
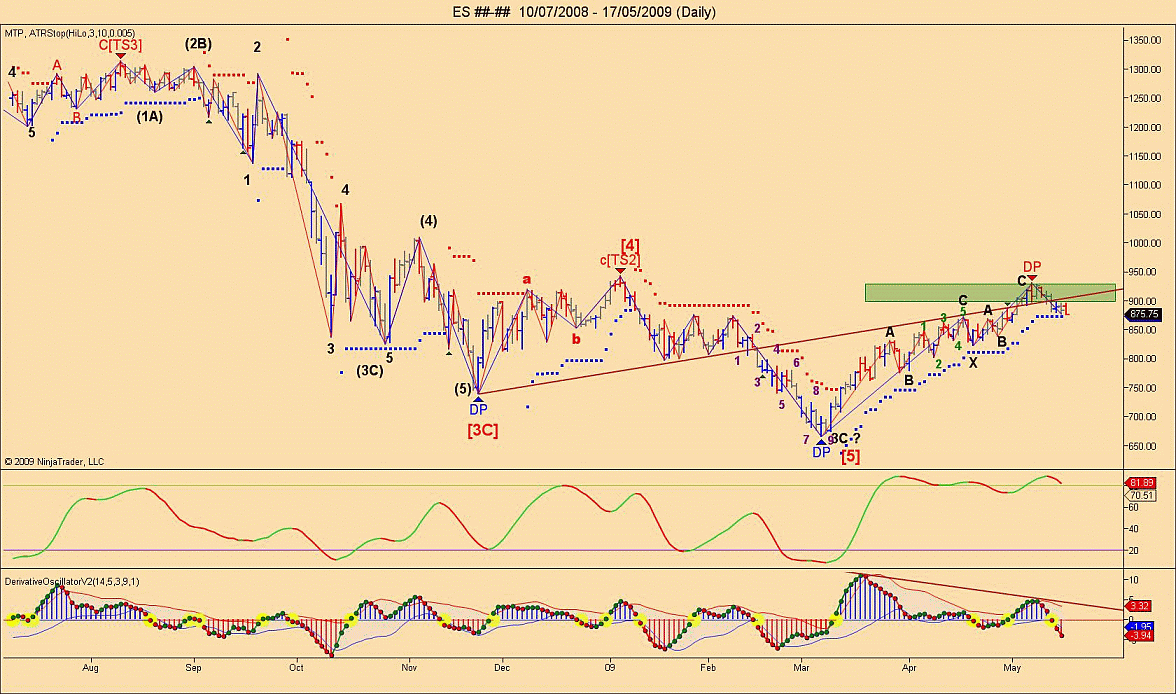
I feel generous today so I will post my daily ES chart with 1 more indicator that I use. You will see that market has stopped right at the green square box called DP (Decision point) and the MTP add on gave an automatic sell signal who got validated once we went lower then the previous low.
We can clearly see that ES was way OB based on the first indicator and the second one was showing divergence so it was pretty clear that odds were favoring a decline from this MTP signal.
We can clearly see that ES was way OB based on the first indicator and the second one was showing divergence so it was pretty clear that odds were favoring a decline from this MTP signal.
Thanks, I had the Derivative Osc indicator already loaded in NT too. But, never really used it as it looked like MACDbb.
I would have thought today would be a down day (DP on your chart) and was surprised by the strength. Did MTP or TTT keep you on the right side?
Originally posted by jcflaw
Hey, it has been long time...have you discovered any secondary indicators that work well with MTP?
Still trading divergence with EW?
John
Hi John, yes I have discovered nice indicators to help me out in my trading but they are not mine so I can't share any of them, sorry about that.
Emini Day Trading /
Daily Notes /
Forecast /
Economic Events /
Search /
Terms and Conditions /
Disclaimer /
Books /
Online Books /
Site Map /
Contact /
Privacy Policy /
Links /
About /
Day Trading Forum /
Investment Calculators /
Pivot Point Calculator /
Market Profile Generator /
Fibonacci Calculator /
Mailing List /
Advertise Here /
Articles /
Financial Terms /
Brokers /
Software /
Holidays /
Stock Split Calendar /
Mortgage Calculator /
Donate
Copyright © 2004-2023, MyPivots. All rights reserved.
Copyright © 2004-2023, MyPivots. All rights reserved.
