MTP applied with Ninjatrader and TTT
Hi everyone, I was asked on the Ninjatrader support forum to show how I was using MTPredictor with Ninjatrader and TTT method.
I will show just a few examples on this forum as it is easier for me that way, of course I won't show all the indicators I use with these signals as I have spent so many hours researching that I don't feel like giving them away.
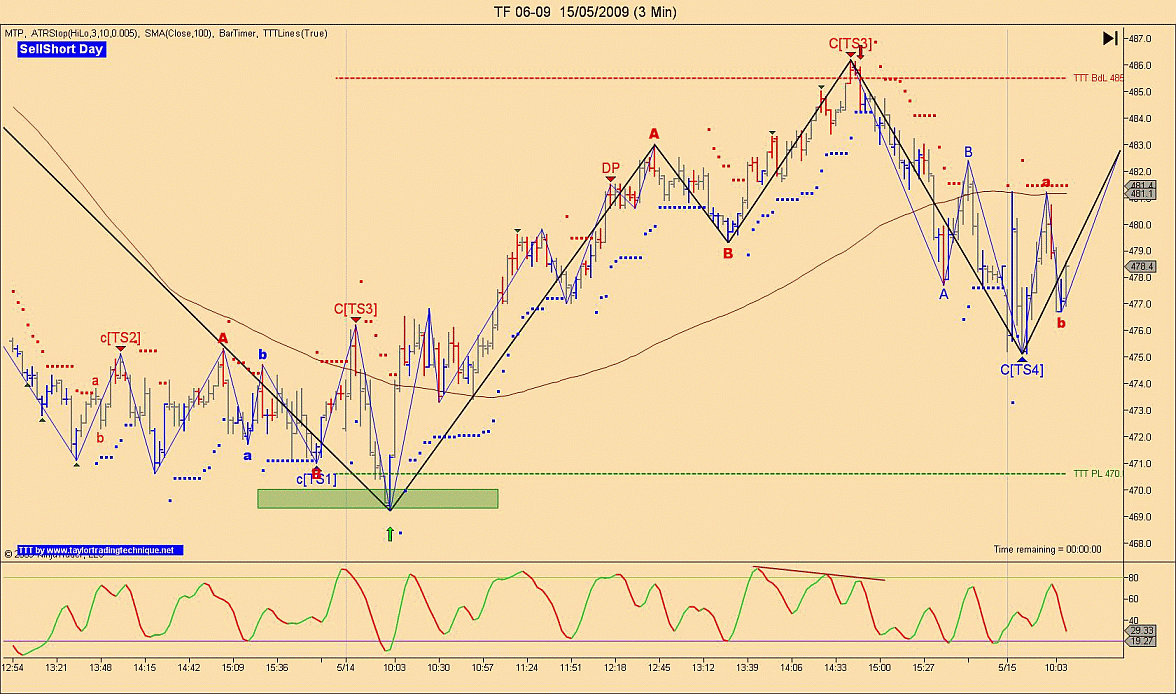
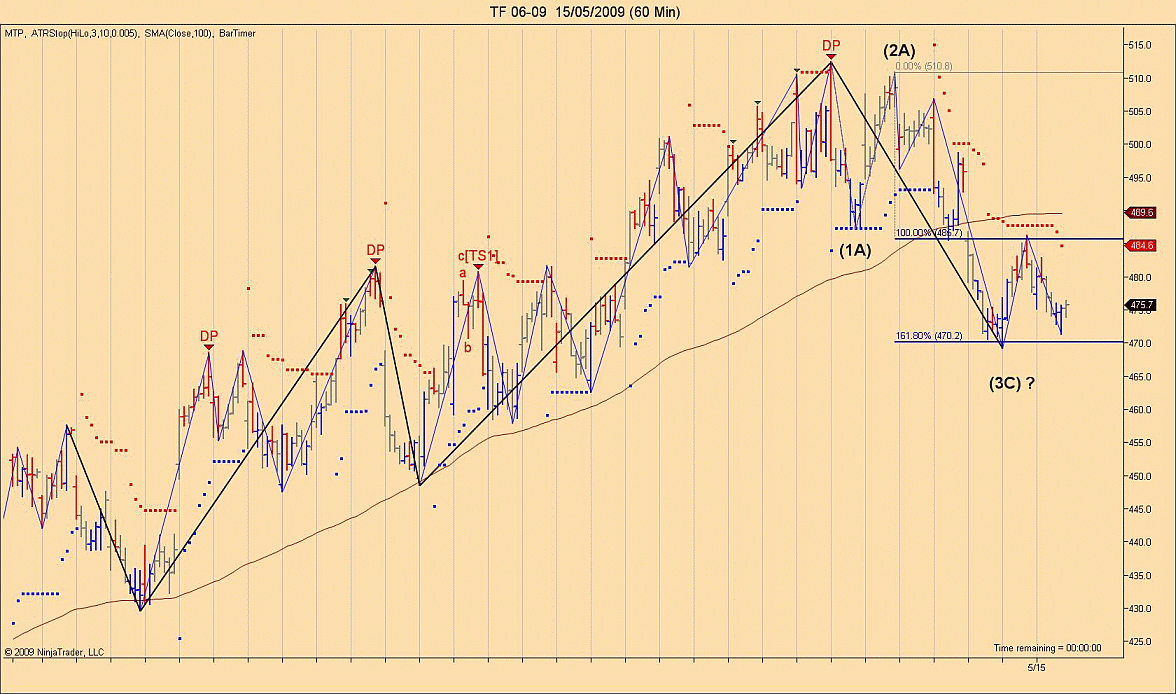
So I will start with the TF Thursday May 14th. First from Richard's TTT e-mail I had this:
to start with Today was a Sell day(Wednesday). We didn't get much of a rally. ES and YM gapped down below the Buy day low and did rally to these lows, while TF and NQ opened above the Buy day low and dropped never looking back. TVGR was in effect all day.
Tomorrow (Thursday)is SS day. We do have 85% chance of getting at least back to the Buy day lows.
So from the opening TF opened at a manual DP level, based on the odds of going back to the buy day low I was a buyer at this level you could say takes some guts to do that but what about if we look at the 60 min chart and see that we are also at the 162% extension level from wave 1 and 2, hum this makes it much more interesting don't you think.
Then around 14:30 we reached the buy day low so it was now time to sell TF as we also had stochastic divergence
Larry, today seem like a nothing day. I wanted to see how you analyzed it.
Thanks
Thanks
quote:
Originally posted by jcflaw
Larry, today seem like a nothing day. I wanted to see how you analyzed it.
Thanks
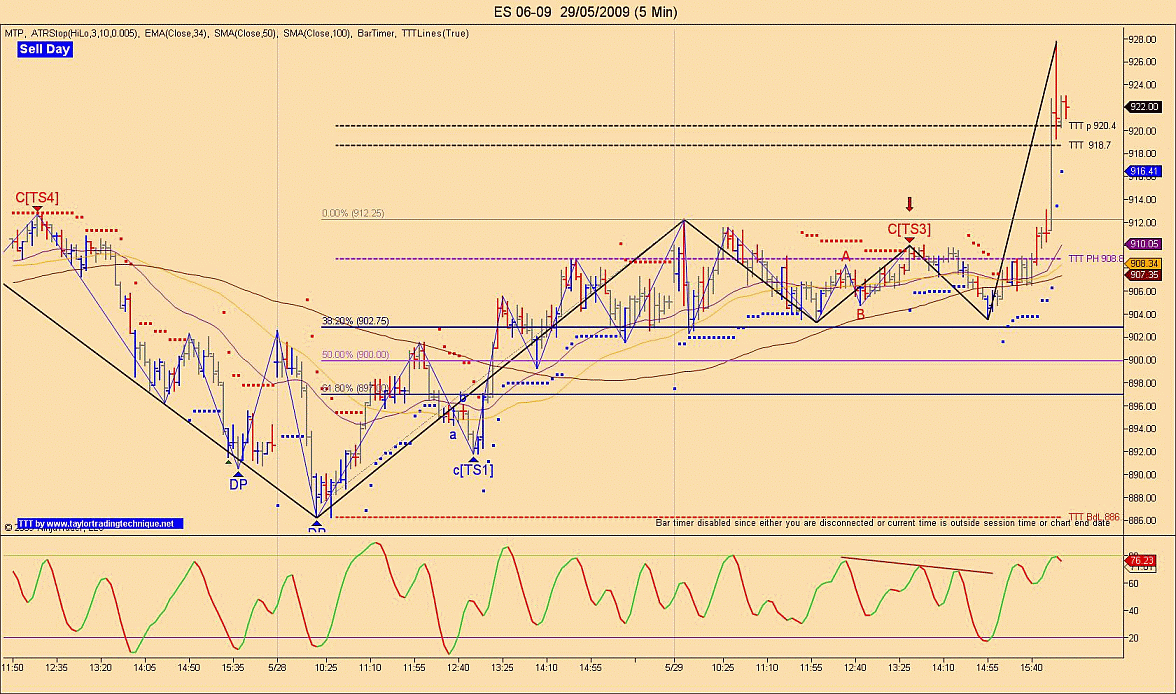
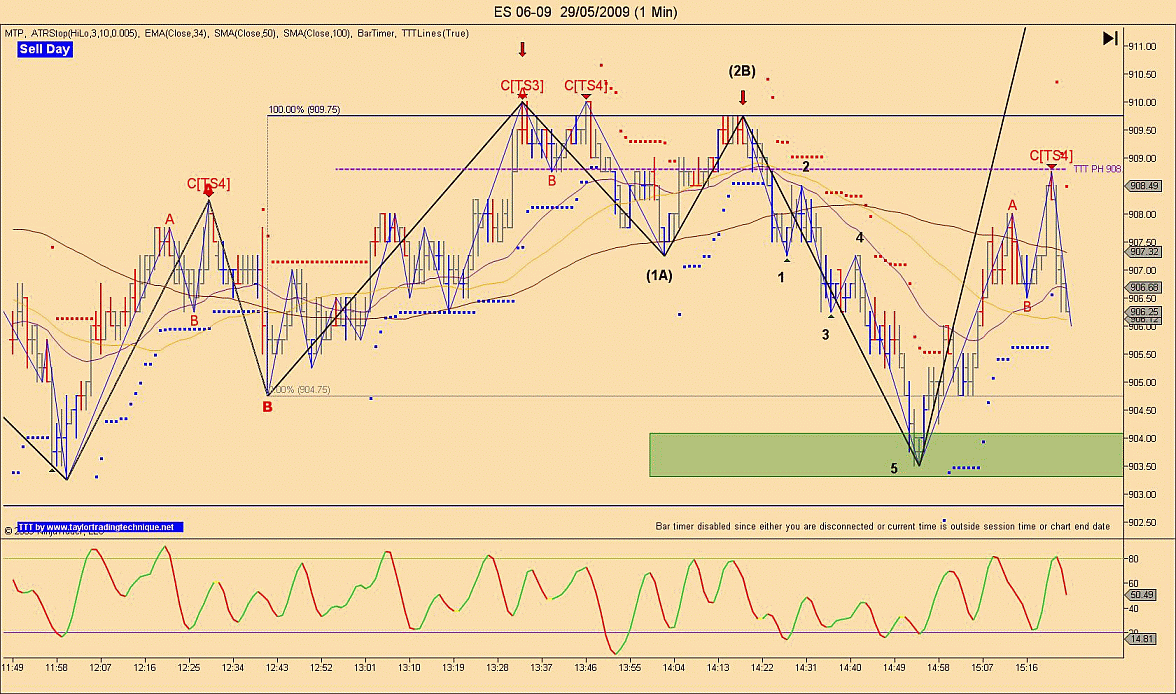
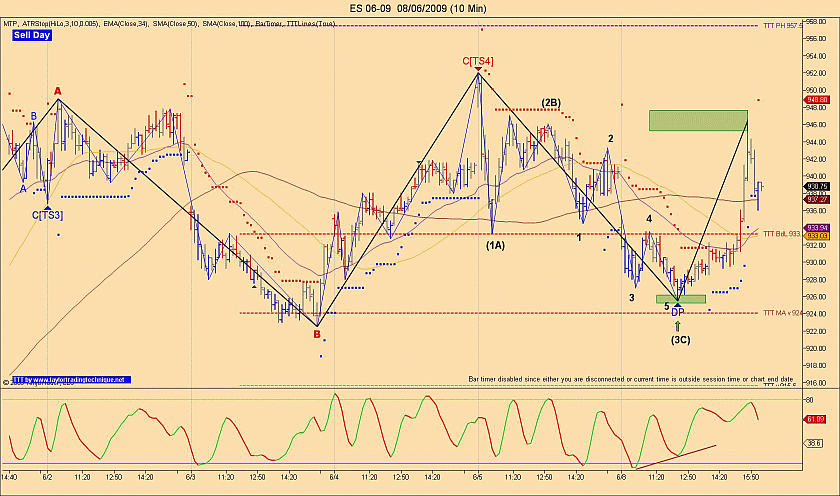
John today was a sell day and these are usually a continuation of the buy day, still it is often a sideways day. I will show you 1 low risk trade that I took based on MTP system, as even if I had an up bias because of a bigger wave count a decline was also possible.You will notice that we had an ABC (TS3) with stochastic divergence and wave C was = to wave A at 909.75, most mportant thing was to secure some profits when they failed to break the 38% retrace from last major wave up on 5 min and the fact that we had 5 waves in wave (3C).
I hope this will help you.
Thanks, I never thought of looking at wave count on 1 minute chart. Have you found the MTP STF oscillator useful? If so,what timeframe?
John
John
quote:
Originally posted by jcflaw
Thanks, I never thought of looking at wave count on 1 minute chart. Have you found the MTP STF oscillator useful? If so,what timeframe?
John
Sorry John I don't use it, I'm not saying it's not good but I rely more on stochastic divergences and other indicators to initiate a trade.
Larry, any good chart set-ups from your trading last week.
Thanks
Thanks
quote:
Originally posted by jcflaw
Larry, any good chart set-ups from your trading last week.
Thanks
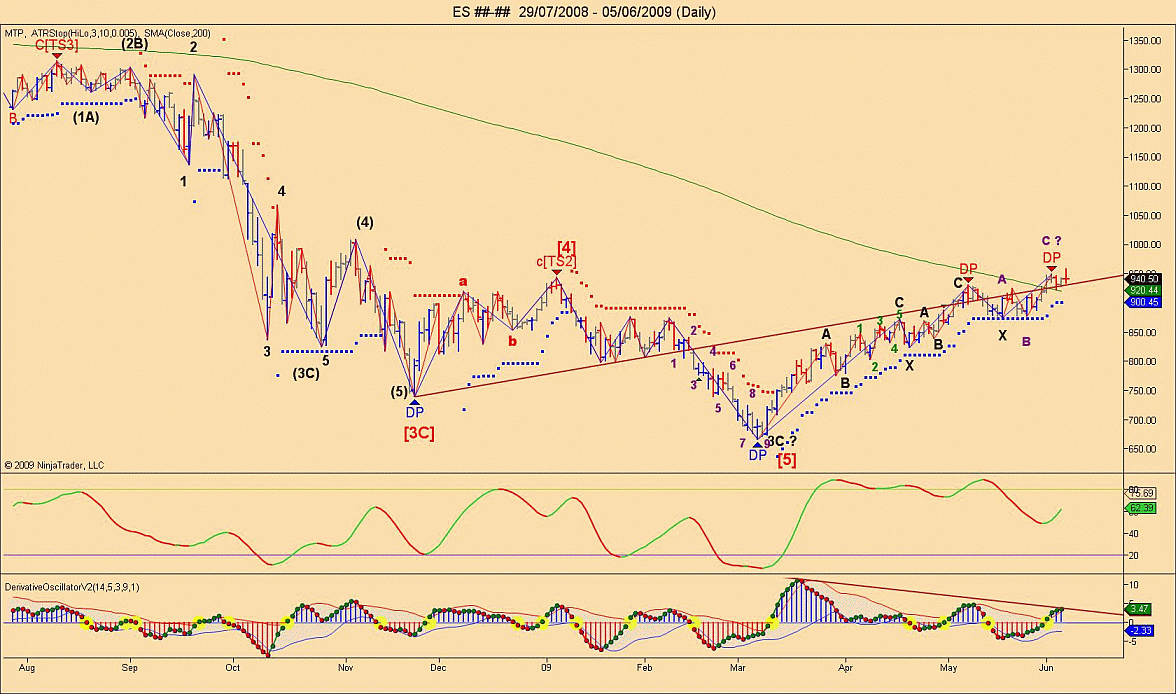
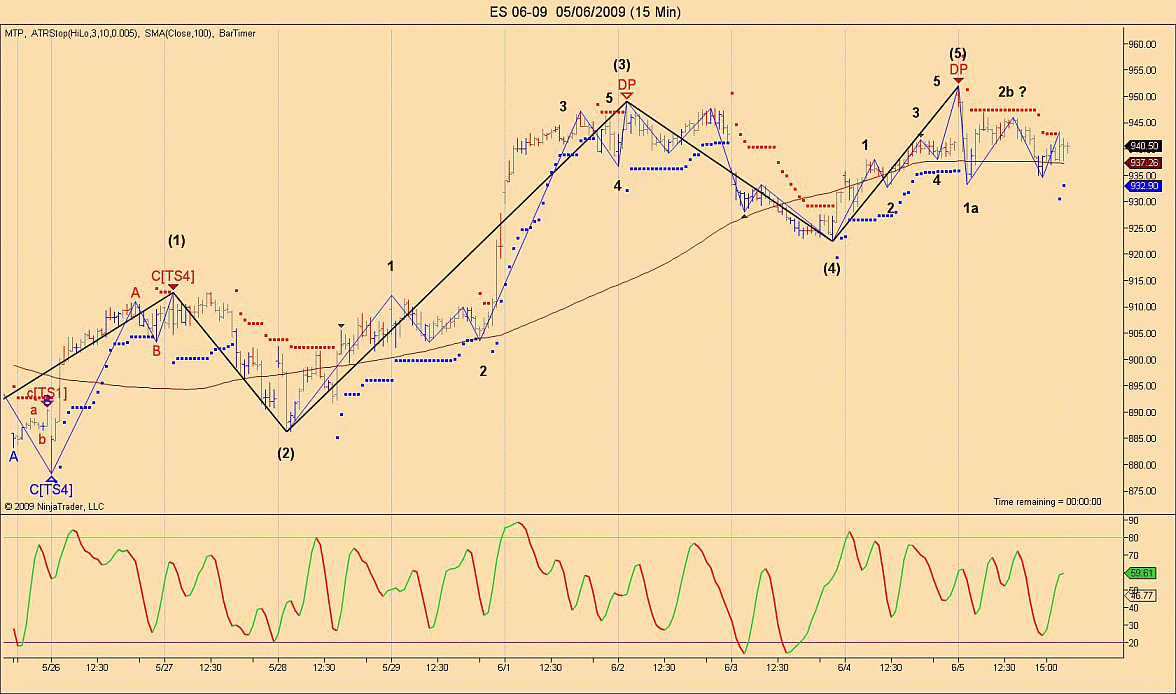
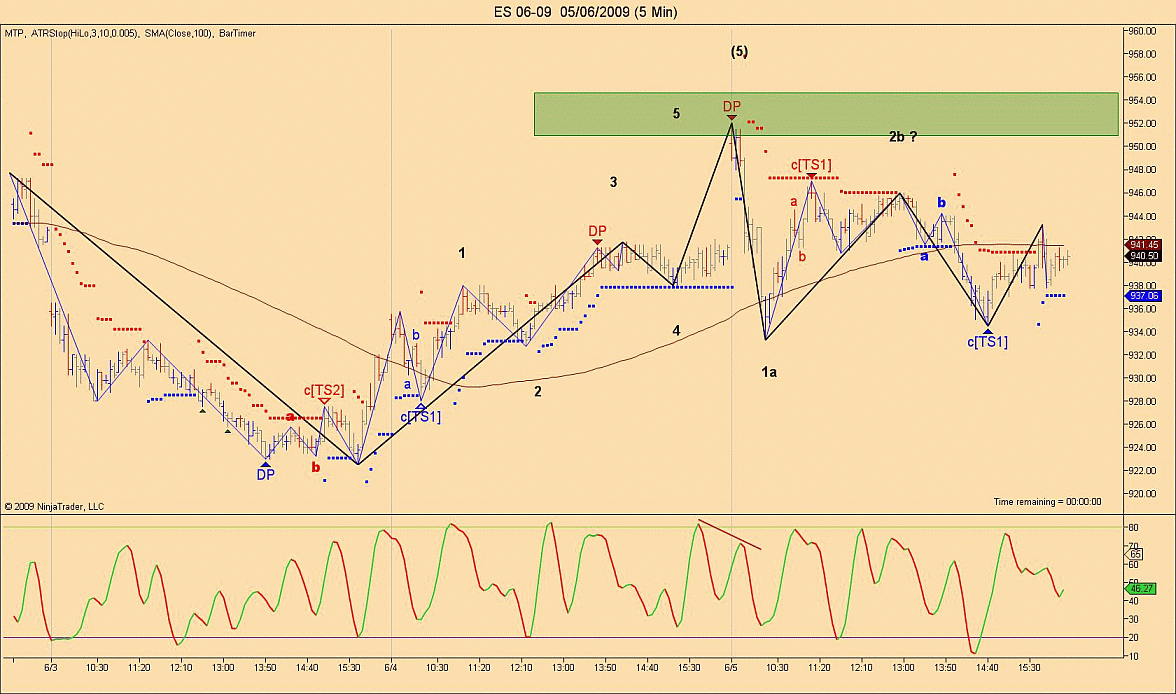
Hi John, yes there were, if you remember from previous post I had shown ES daily chart with potential C wave up underway and normally C waves unfold in 5 waves, well wave 5 of 5 unfolded at the opening Friday so this was a must sell. If you look closely you can see the 5 waves in the C leg on daily but on 15 min they are easy to spot with the major filter then you can clearly see that we also had 5 waves in wave 5 and we were at DP from major wave 3 high, 15 or 5 min.
I hope this will help you understand a bit more EW and MTP.
P.S. The ES had also achieved his TTT target at 956.9 on 24 hr session current high was 957.50 so I knew top was in for sure at the opening of day session, not bad.
As Larry said we had reached the TTT average Penetration levels just before the open on Friday. That also caused a gap up above the SS day high.
We knew that ES gets a Decline 93% of the time on Buy days. So shorting was the way to go at least until we reached the SS day high.
In this case we did continue to decline and although we did get a smaller decline when calculated from the SS day high we did get a 25 point decline from the top on Friday and based on te recap MA report that is the range that was to be expected.
Today we had one good trade when we had 5 waves that unfolded in possible wave (3C), we also had stochastic divergence and a DP from wave 3 low we were also under the buy day low.
I saw a TS3 set-up on 3m chart too.
Larry, any great setups recently?
Originally posted by jcflaw
Hey, it has been long time...have you discovered any secondary indicators that work well with MTP?
Still trading divergence with EW?
John
Hi John, yes I have discovered nice indicators to help me out in my trading but they are not mine so I can't share any of them, sorry about that.
Emini Day Trading /
Daily Notes /
Forecast /
Economic Events /
Search /
Terms and Conditions /
Disclaimer /
Books /
Online Books /
Site Map /
Contact /
Privacy Policy /
Links /
About /
Day Trading Forum /
Investment Calculators /
Pivot Point Calculator /
Market Profile Generator /
Fibonacci Calculator /
Mailing List /
Advertise Here /
Articles /
Financial Terms /
Brokers /
Software /
Holidays /
Stock Split Calendar /
Mortgage Calculator /
Donate
Copyright © 2004-2023, MyPivots. All rights reserved.
Copyright © 2004-2023, MyPivots. All rights reserved.
