Monkey ES Charts for 5/20
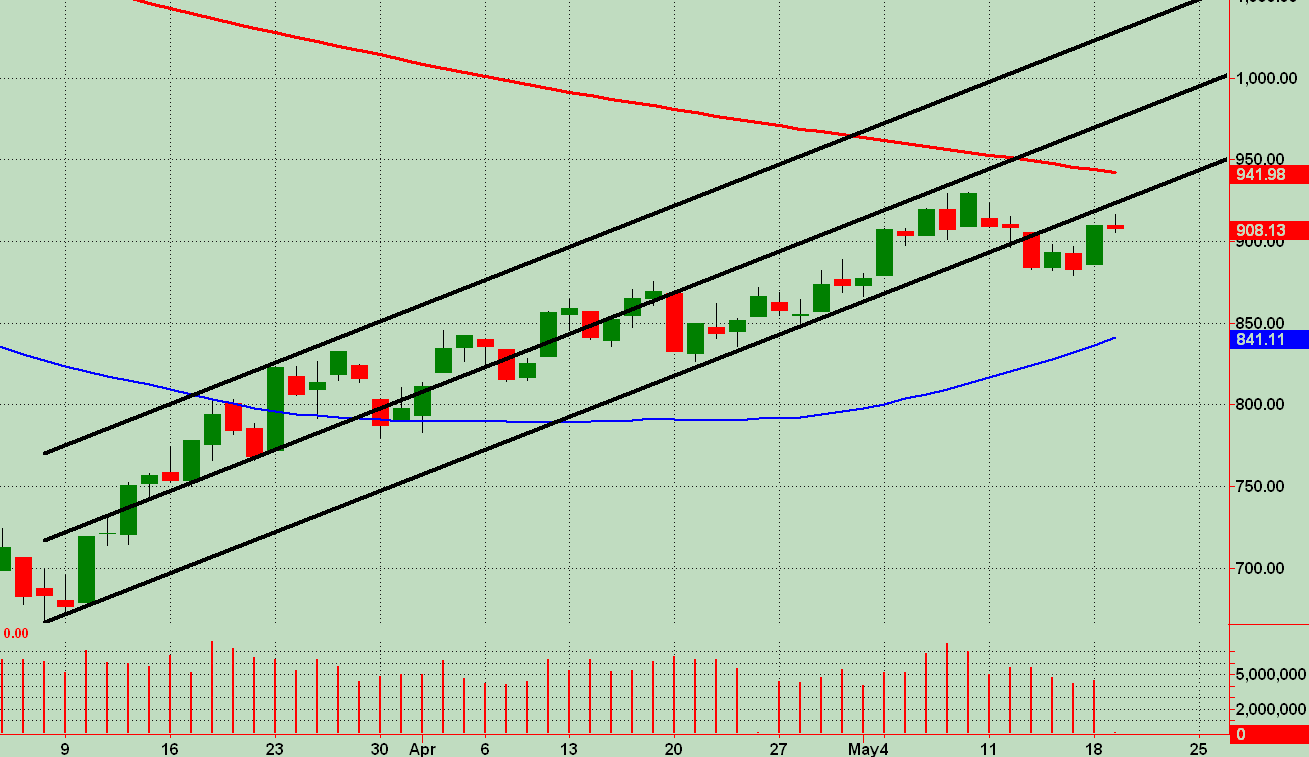
Just posting some macro daily charts and also a 13 Min chart with price action S/R zones drawn in with horizontal blue lines. First chart is SP-500 Index with trend channel in black lines ... broke below lower line a few days back and may test it on a rally. Notice that volume has diminished on this pullback in what has been a persistent uptrend.
Click image for original size
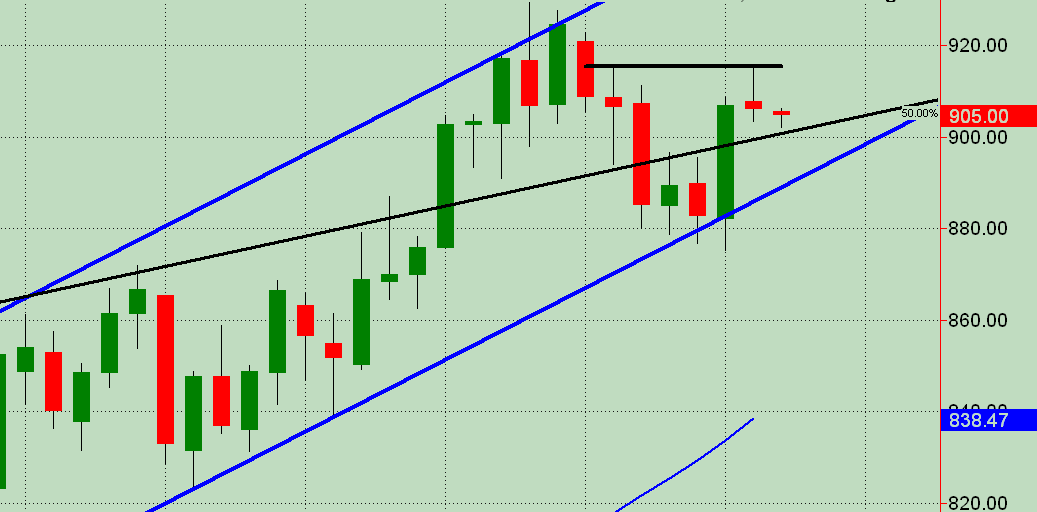
ES Daily chart shows an NR7 (24hr data) FWIW. Just another observation with a trend channel in blue drawn from a point later than the prior chart that was drawn from the Mar low. Has contained price fairly well for several weeks. Also, price reacted off a high from a few days back as drawn by the horizontal black line ... which also is near the middle of the down day (which was an inside day of an inside day) that had a semi-decent range ... and would be a reaction off of a "midline" of the channel were I to have drawn it in.
Click image for original size
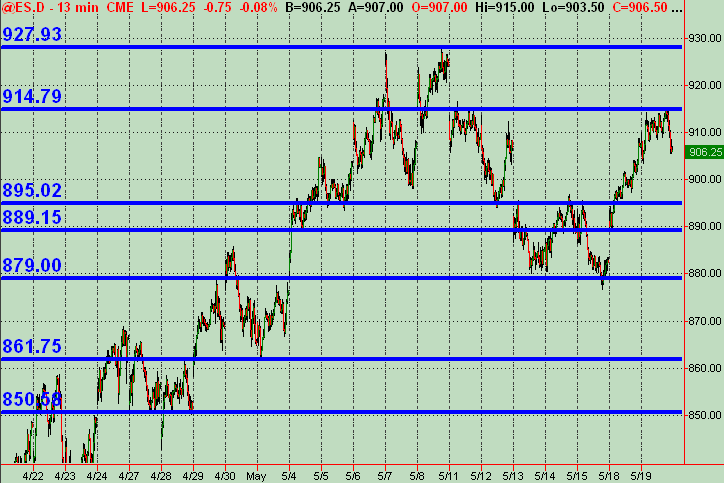
ES 13 Min chart with price action zones of potential S/R ... drilling down a bit more as a "map" for trading coming into Wednesday. Any and all comments, feedback and analysis (espec. with posted charts) are encouraged and welcome !!!
Click image for original size
Emini Day Trading /
Daily Notes /
Forecast /
Economic Events /
Search /
Terms and Conditions /
Disclaimer /
Books /
Online Books /
Site Map /
Contact /
Privacy Policy /
Links /
About /
Day Trading Forum /
Investment Calculators /
Pivot Point Calculator /
Market Profile Generator /
Fibonacci Calculator /
Mailing List /
Advertise Here /
Articles /
Financial Terms /
Brokers /
Software /
Holidays /
Stock Split Calendar /
Mortgage Calculator /
Donate
Copyright © 2004-2023, MyPivots. All rights reserved.
Copyright © 2004-2023, MyPivots. All rights reserved.