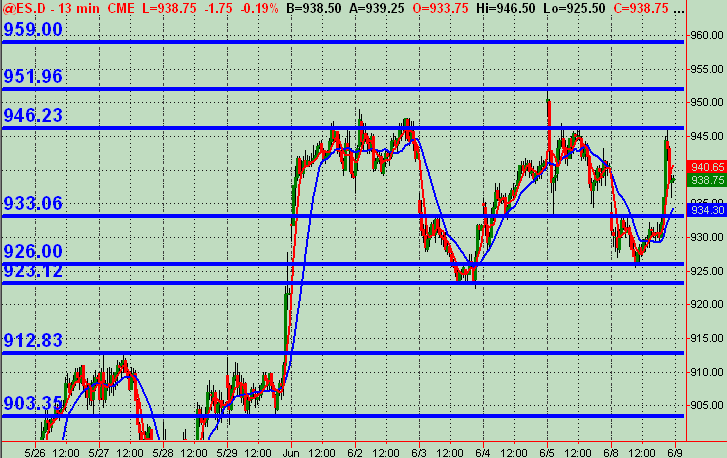
Monkey ES "Map" for Tu 6/9
13min chart with the blue lines as price action S/R levels/zones ... as a map for the trading session.
Open to any feedback and others' charts for tomorrow's trading!!
Click image for original size
Open to any feedback and others' charts for tomorrow's trading!!
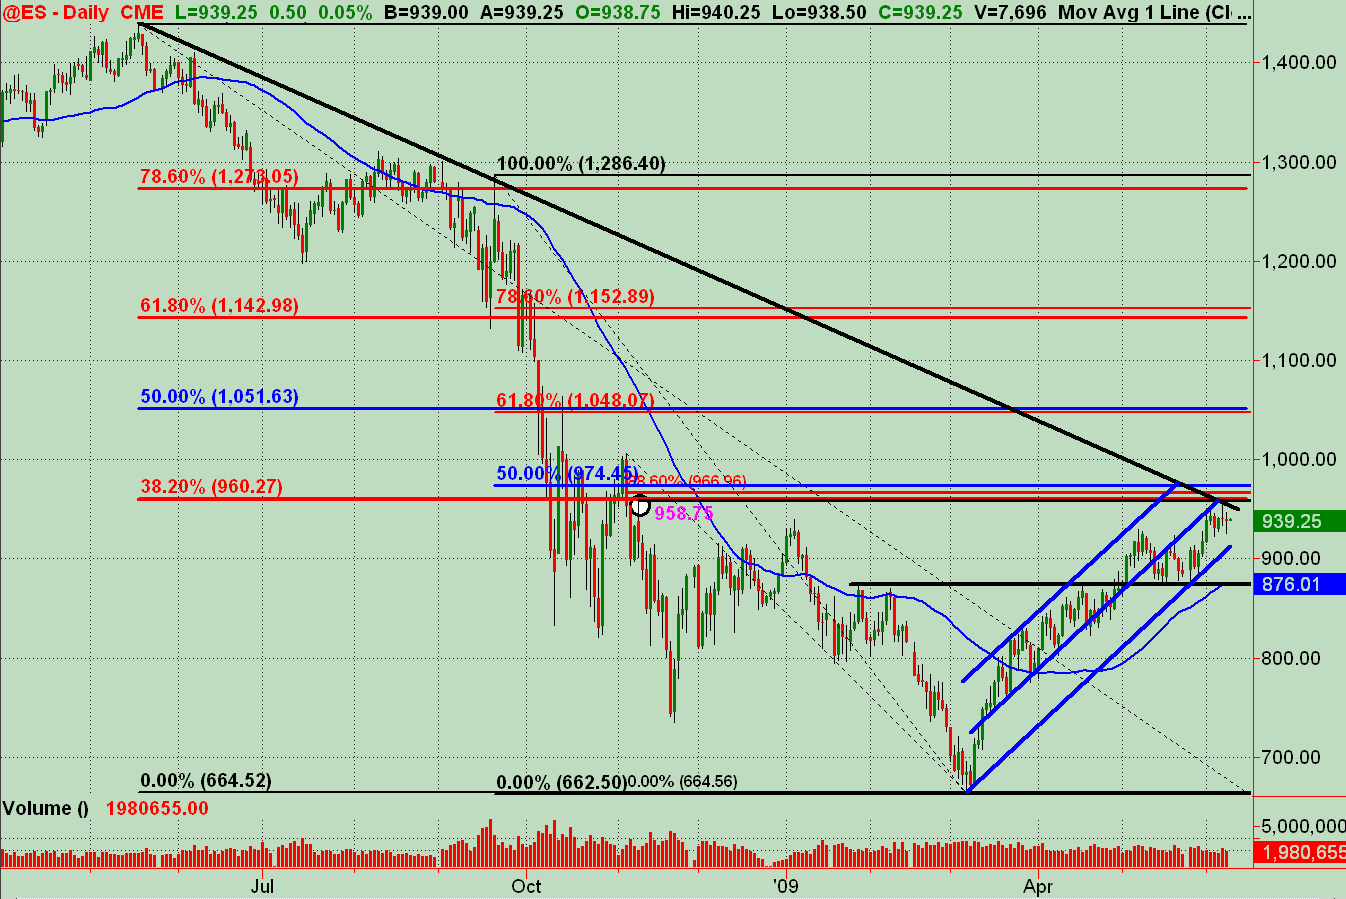
Also have an interesting ES Daily chart ... Black downsloping trendline coincides with the same general (larger picture) area of resistance price levels from clustered fib retracement along with a swing high circled on the left side of the chart ... the blue uptrending channel lines come into this area of both "price and time" FWIW. Just another observation looking at the bigger picture.
Click image for original size
thx for the charts, going to take a lot of buyers to push thru that 960-966 area and hold.
thanks Joe and MM...for me I have the obvious 42 and then 47 - 49......failure above the overnight high will go getthe 36.50 number...we are set to open near overnight 42 high......report at 10...Or trade in affect as we are opening out of value
Emini Day Trading /
Daily Notes /
Forecast /
Economic Events /
Search /
Terms and Conditions /
Disclaimer /
Books /
Online Books /
Site Map /
Contact /
Privacy Policy /
Links /
About /
Day Trading Forum /
Investment Calculators /
Pivot Point Calculator /
Market Profile Generator /
Fibonacci Calculator /
Mailing List /
Advertise Here /
Articles /
Financial Terms /
Brokers /
Software /
Holidays /
Stock Split Calendar /
Mortgage Calculator /
Donate
Copyright © 2004-2023, MyPivots. All rights reserved.
Copyright © 2004-2023, MyPivots. All rights reserved.