Monkey S/R Levels for Tuesday 6/16
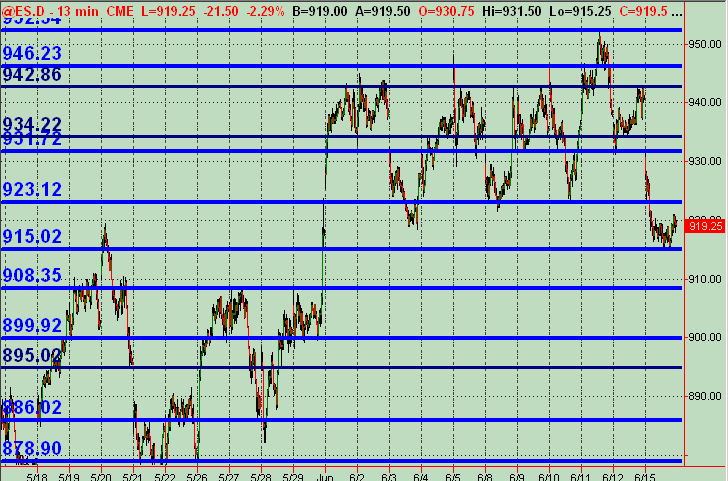
Here's the 13min ES chart with price action S/R levels/zones that I have as a "map" for Tuesday's trading. Any comments, charts etc. are encouraged. The thicker royal blue lines are more significant while the navy thinner lines are likely important levels but not as significant as the others.
Click image for original size
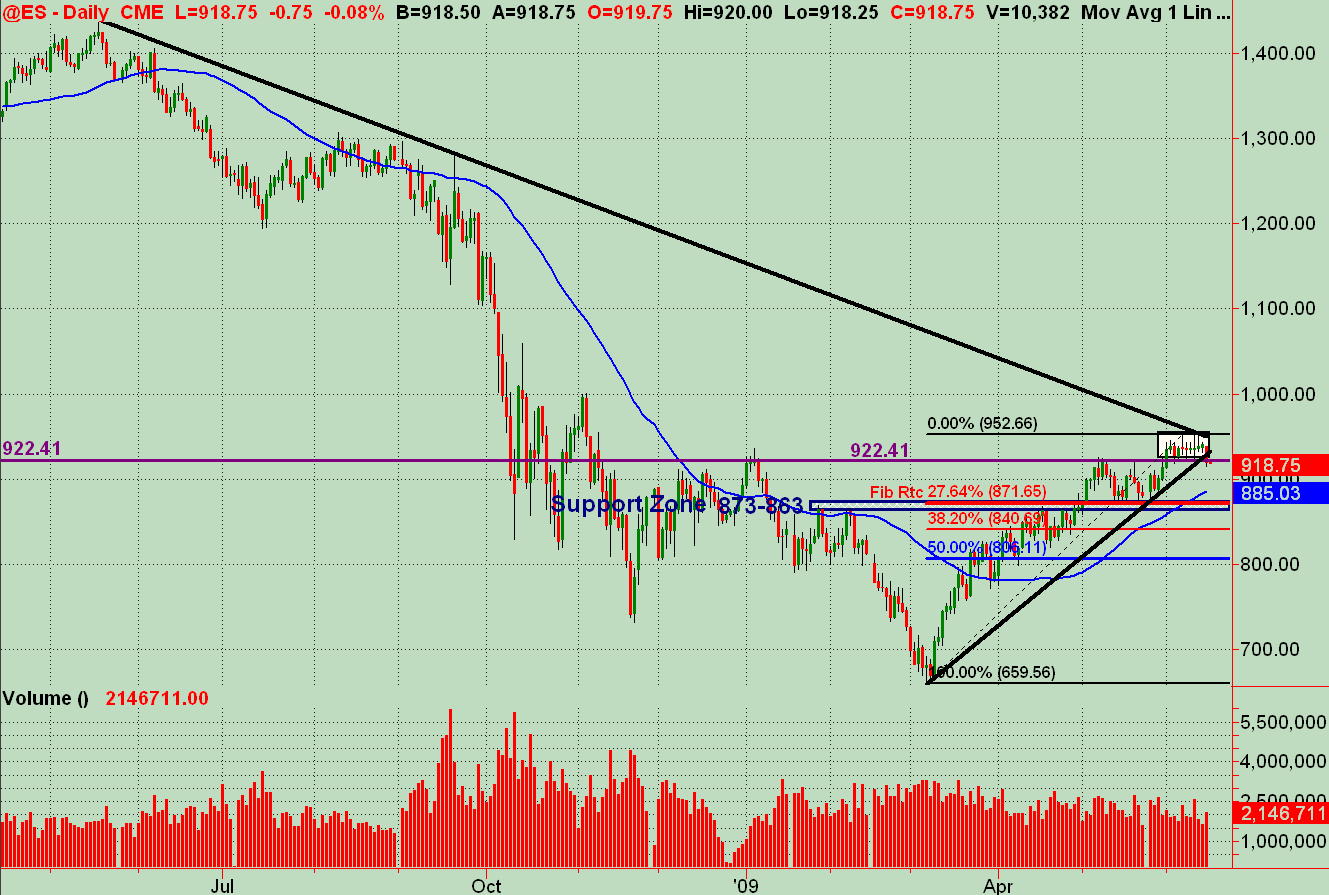
ES Daily Chart with Big picture showing some significant support levels and trendlines etc.
Click image for original size
Emini Day Trading /
Daily Notes /
Forecast /
Economic Events /
Search /
Terms and Conditions /
Disclaimer /
Books /
Online Books /
Site Map /
Contact /
Privacy Policy /
Links /
About /
Day Trading Forum /
Investment Calculators /
Pivot Point Calculator /
Market Profile Generator /
Fibonacci Calculator /
Mailing List /
Advertise Here /
Articles /
Financial Terms /
Brokers /
Software /
Holidays /
Stock Split Calendar /
Mortgage Calculator /
Donate
Copyright © 2004-2023, MyPivots. All rights reserved.
Copyright © 2004-2023, MyPivots. All rights reserved.