Monkey Charts for 6/25
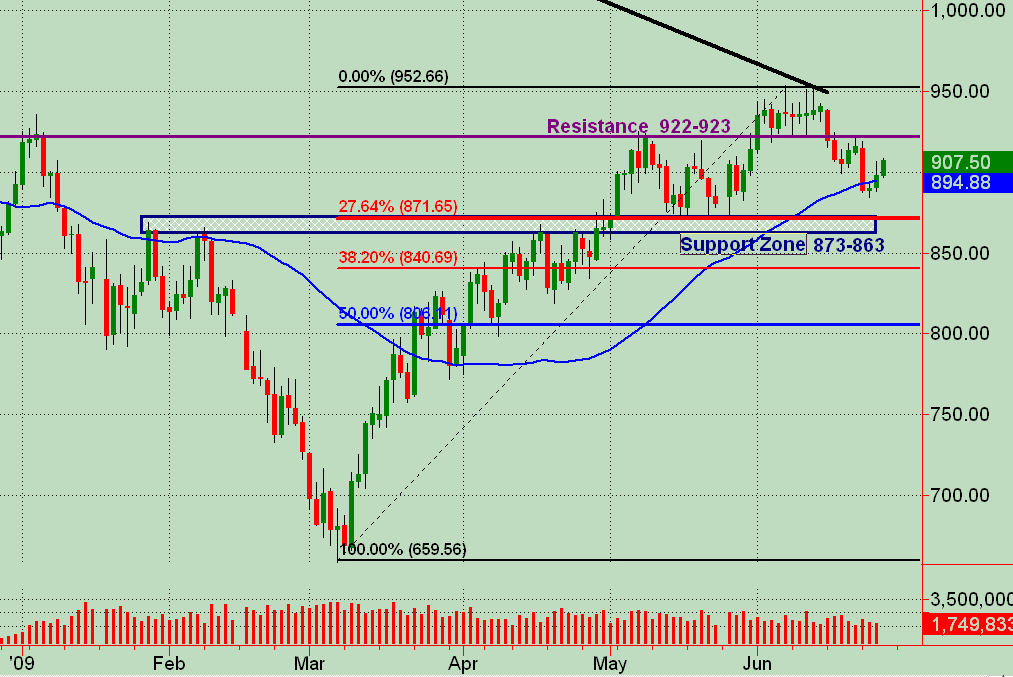
Have the daily with S/R price lines and the 13min also with price action S/R lines as a map for Thursday's trading. Open to any comments, analysis, additional charts, feedback etc.!
Click image for original size
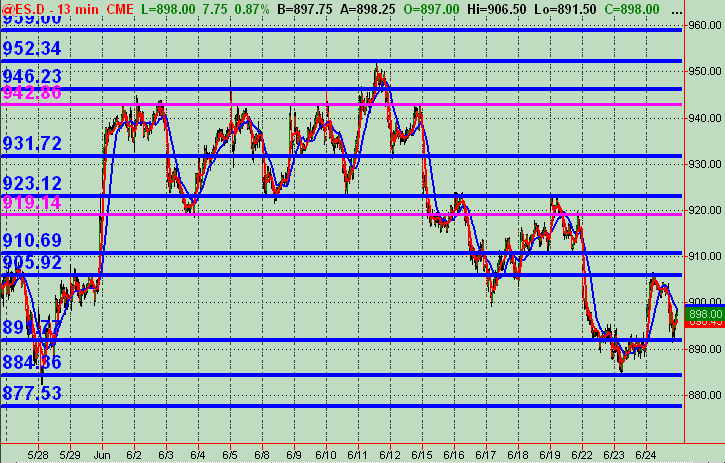
13min ... blue lines more significant ... magenta lines somewhat significant. Again, a "map" for the day where pivots (daily and espec. weekly) and MP value area prices might cluster for a better market "read" as the day unfolds.
Click image for original size
As of 11:30pm CST, ES spiked up and is trading into 907 area where a price action resistance level, the daily R1 and the VAH are tightly clustered. NQ hit its Wkly Pivot at 1461 area coincident with ES spike. ES 910.75 is RTH low of 6/19 that would fill the gap on the daily which coincides with price action support intraday (5min chart) at roughly the same price level.
Emini Day Trading /
Daily Notes /
Forecast /
Economic Events /
Search /
Terms and Conditions /
Disclaimer /
Books /
Online Books /
Site Map /
Contact /
Privacy Policy /
Links /
About /
Day Trading Forum /
Investment Calculators /
Pivot Point Calculator /
Market Profile Generator /
Fibonacci Calculator /
Mailing List /
Advertise Here /
Articles /
Financial Terms /
Brokers /
Software /
Holidays /
Stock Split Calendar /
Mortgage Calculator /
Donate
Copyright © 2004-2023, MyPivots. All rights reserved.
Copyright © 2004-2023, MyPivots. All rights reserved.