Trend Change or retracement?
I have a question I am looking for help on.
Has someone found a reliable indicator, or combination of indicators, or some other way, that from their personal trading experience can tell if an intra day direction change is a trend change as opposed to a retracement?
To explain my question further, some days the first leg is down, it retraces, and then the second leg is down, that is Leg2 is in the same direction as Leg1. On other days, the first leg is down and then it reverses trend and the remainder of the day is an uptrend.
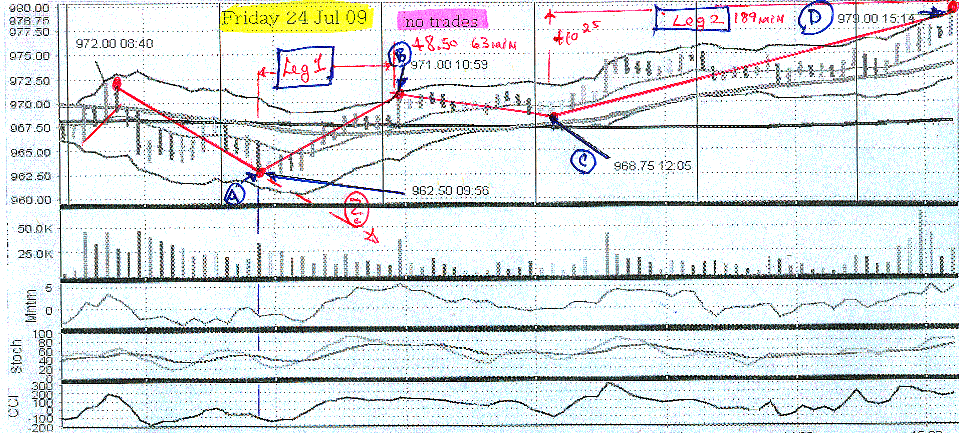
I have included a 5 min chart of Friday 24 July 2009 for the ESU9 (S&P emini Sep 09) contract, as an example (all times are CT).
From 972 at 8:40am it fell to 962.50 at 9:56 (marked point A). From A it rose to 971 at 10:59 or +8.5 pts in 63 min (point B). A to B I am calling Leg1.
Next it retrace to 968.75 at 12:05 or –2.25 pts in 66 mins (point C). Then it rises to 979 @ 15:14 or +10.25 in 189 mins (point D). From C to D I am calling Leg2.
In this example point A marks a Trend Change with the balance of the day now upward.
So in reference to this graph, my question is:
“At point A is there a way to tell that the balance of the day will be up?”
In other words:
“Is there a way to tell if point A will be marking the beginning of a retracement, that the next leg after the retracement will be down, that is in the same direction as 972 to 962.50, or is it a intra day trend change?”
I would note that one book waits until it has risen from A and it continues to rise beyond 61.8% or 968.25 and if it does then a trend change has taken place and the rise is not a retracement. (972-962.5 = 9.5*.618 = 5.75+962.5 =>968.25 = 61.8%.) I am looking for an answer at point A so this “if it retraces more than 61.8% it is a trend change” is not the answer I am looking for.
Thank-you to all.
Has someone found a reliable indicator, or combination of indicators, or some other way, that from their personal trading experience can tell if an intra day direction change is a trend change as opposed to a retracement?
To explain my question further, some days the first leg is down, it retraces, and then the second leg is down, that is Leg2 is in the same direction as Leg1. On other days, the first leg is down and then it reverses trend and the remainder of the day is an uptrend.
I have included a 5 min chart of Friday 24 July 2009 for the ESU9 (S&P emini Sep 09) contract, as an example (all times are CT).
From 972 at 8:40am it fell to 962.50 at 9:56 (marked point A). From A it rose to 971 at 10:59 or +8.5 pts in 63 min (point B). A to B I am calling Leg1.
Next it retrace to 968.75 at 12:05 or –2.25 pts in 66 mins (point C). Then it rises to 979 @ 15:14 or +10.25 in 189 mins (point D). From C to D I am calling Leg2.
In this example point A marks a Trend Change with the balance of the day now upward.
So in reference to this graph, my question is:
“At point A is there a way to tell that the balance of the day will be up?”
In other words:
“Is there a way to tell if point A will be marking the beginning of a retracement, that the next leg after the retracement will be down, that is in the same direction as 972 to 962.50, or is it a intra day trend change?”
I would note that one book waits until it has risen from A and it continues to rise beyond 61.8% or 968.25 and if it does then a trend change has taken place and the rise is not a retracement. (972-962.5 = 9.5*.618 = 5.75+962.5 =>968.25 = 61.8%.) I am looking for an answer at point A so this “if it retraces more than 61.8% it is a trend change” is not the answer I am looking for.
Thank-you to all.
Click image for original size
one possible idea is to look at what is happening in the other markets...on Friday the Nq wasn't breaking out of the low.....when the ES was...we've written about that here but I don't think there is a specific thread, although ym and es divergences work well too.......I would read through Dr Brett's site Traderfeed.com as he has some good writing on the $ticks and other ways to attempt to follow the markets....
There is just no way to tell in advance ALL the time but market profile can give you some good clues and you might trying snapping two lines at the 5 minute high and low and use that for an opening range in this volatility ( or lack of)....are we getting support above the 5 minute high or low etc....
my shorter answer is that anyone who tells you they can tell it was an intraday trend change is a liar at point A...may make a great after the fact book but not in the real world...one thing I like to keep in mind is "where is the previous days high or low and which one are we farther from"..in other words how far do we need to travel to break the previous days range...certainly not perfect but it can help.....probably not the answer u r looking for but that's the only one I have
and here is a divergence thread I started 2-3 years ago.......but Dr. B does a better job IMHO...
http://www.mypivots.com/forum/topic.asp?TOPIC_ID=1287&SearchTerms=pitbull
http://www.mypivots.com/forum/topic.asp?TOPIC_ID=1287&SearchTerms=pitbull
blue,
Check out 30min RSI, do away with the oversold lines and watch the #50 draw large channels, small channels and trendlines. It gives the best idea of what your asking that I know of...and that with MP is even better.
A good after the fact analysis as bruce called it is the ES now. The trend is up, RSI and the ES pulled back from 976.50 and if you draw a line from RSI low on Tues and low on wends you get the low on friday. And with the RSI being @50 that too was a good place for the bulls to resume. But like bruce said you can never know for sure.
sounds like a free commercial for the Woodster.......can you post a better response to help out Blue..?
I don't know if this can be of any help to you but here's a link to show you how I knew that a low was probably in the ES around 962.50
This may not be an easy answer but that's how I try to pinpoint if we have a possible top or bottom.
http://www.mypivots.com/forum/topic.asp?TOPIC_ID=4400&whichpage=7
This may not be an easy answer but that's how I try to pinpoint if we have a possible top or bottom.
http://www.mypivots.com/forum/topic.asp?TOPIC_ID=4400&whichpage=7
quote:No commercial. I use it extensively to trade es/nq pairs in a very profitable way
Originally posted by BruceM
sounds like a free commercial for the Woodster.......can you post a better response to help out Blue..?
well it doesn't address his specific question......ok, nuff said we'll help out the woodie folks some..I'm sure you aren't planning to give us some specifics but if you do we'll be here waiting for these "profitable ways" applied to fridays trade
At 962.21 spinning top, at 963 two line engulfing, establishing intraday uptrend
979 last engulfing top. reversal follows. Trading 974.75 right now.
quote:
Originally posted by zodei1
Any guesses on what his "squeeze indicator" is?
As I know its a MidRange Indkator with 5 Bars .....and the Average is also 5 or something like that
Thanks Zodei1,
I'm not clear on your reply.
What do you mean by a midrange indicator?
Emini Day Trading /
Daily Notes /
Forecast /
Economic Events /
Search /
Terms and Conditions /
Disclaimer /
Books /
Online Books /
Site Map /
Contact /
Privacy Policy /
Links /
About /
Day Trading Forum /
Investment Calculators /
Pivot Point Calculator /
Market Profile Generator /
Fibonacci Calculator /
Mailing List /
Advertise Here /
Articles /
Financial Terms /
Brokers /
Software /
Holidays /
Stock Split Calendar /
Mortgage Calculator /
Donate
Copyright © 2004-2023, MyPivots. All rights reserved.
Copyright © 2004-2023, MyPivots. All rights reserved.