Study says pivots don't work?
This simple study says that pivot points don't work; they author tested 10 major currency pairs for 2006 to the present and found that the price was no more likely to revert back to the pivot point than any other number [url]http://www.myforexdot.org.uk/PivotPointAnalysis.html[/url].
If pivots work, can someone suggest something that can be back tested to show that they have some statistical significance?
If pivots work, can someone suggest something that can be back tested to show that they have some statistical significance?
From my understanding of pivots they are simply a way to predict probable areas of support and resistance. I have not read the study, but it would seem to me very difficult to measure how effective they are when there are multiple ways that pivots can be used. Some will fade them while others will use them as breakout levels. I myself use them in conjunction with MP value areas to pinpoint likely reversal points.
Since Al Brooks is being referenced why not think about what he says about trading being a grey area - it is not an exact science. Any trader who expects to wake up every day and place a buy order at S1 and a sell order at R1 will quickly become disappointed.
Knowing what else is going on near pivot points will allow you to determine if they should be used and how they should be used.
Just my 2¢
quote:
Originally posted by blue
Hi RexSpeed
How do you use the daily PP?
02-Sep
High 999.75
Low 991.00
Open 993.25
Close 993.75
Classic
S1 985.25
(nothing close)
--------------------------------------------------------------------
I would tell you, but I would have to shoot you...LOL
BTW, RTH high today 1003.25 wk/s3 1003.00
sorry that should be wk/s2 1003.00
03-Sep
High 1003.25
Low 991.25
Classic
R2 1005.50
S1 989.75
Classic - weekly
S2 1003.00
S3 979.00
High 1003.25
Low 991.25
Classic
R2 1005.50
S1 989.75
Classic - weekly
S2 1003.00
S3 979.00
RE; Al Brooks, after reading the Amazon reviews I am going to wait for the second edtion.
quote:I very much understand. It's a hard book to "get through", although it was worth it for me.
Originally posted by Bruce Johnson
RE; Al Brooks, after reading the Amazon reviews I am going to wait for the second edtion.
04-Sep
High 1016.25
Low 1000.75
Classic
R2 1012.00
PP 999.00
Classic - weekly
S2 1003.00
S3 979.00
--------Daily Pivots for 3-Sept-2009
Classic
R3 1015.50
R1 999.75
On graph of 4-Sept I drew 3-Sept daily PP
High 1016.25
Low 1000.75
Classic
R2 1012.00
PP 999.00
Classic - weekly
S2 1003.00
S3 979.00
--------Daily Pivots for 3-Sept-2009
Classic
R3 1015.50
R1 999.75
On graph of 4-Sept I drew 3-Sept daily PP
Click image for original size
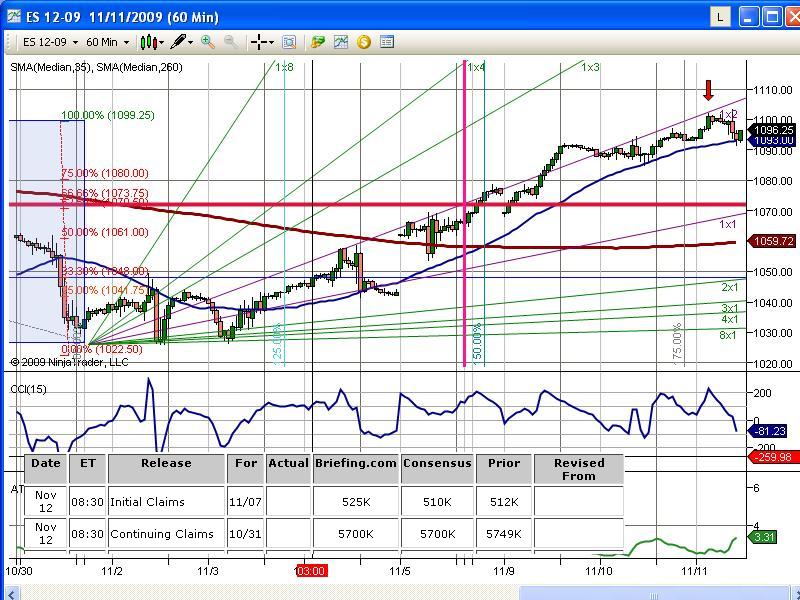
The preopen number at 7:36CT is mistyped. The correct value is 1000 even for the low of the bar. This is only 0.25 off 999.75.
For the weekly numbers:
Classic - weekly
S1 1015.25
S2 1003.00
provide good matches
The high 1015.50@14:02CT is an exact match to the 1015.50 line.
For the weekly numbers:
Classic - weekly
S1 1015.25
S2 1003.00
provide good matches
The high 1015.50@14:02CT is an exact match to the 1015.50 line.
quote:
Originally posted by Bruce Johnson
RE; Al Brooks, after reading the Amazon reviews I am going to wait for the second edtion.
Al is somewhat hard to follow, You really don't need to explain things in that detailed fashion. Not near as bad as murray math though that guy needs help. But I use some of the things Al Brooks describes and I think they work well in any market. Watching 5min highs/lows, trend bars, not fading full body impulse bars but going with them. These things will always work.
No real matches. Today was a day with only some traders back from the long weekend and a very narrow trading range.
08-Sep
High 1025.75
Low 1019.00
Daily Classic
R2 1017.25
R1 1011.25
Weekly Classic
R1 1030.25
PP 1009.25
08-Sep
High 1025.75
Low 1019.00
Daily Classic
R2 1017.25
R1 1011.25
Weekly Classic
R1 1030.25
PP 1009.25
Study wasn't usin' them right. Nuff' said.
Emini Day Trading /
Daily Notes /
Forecast /
Economic Events /
Search /
Terms and Conditions /
Disclaimer /
Books /
Online Books /
Site Map /
Contact /
Privacy Policy /
Links /
About /
Day Trading Forum /
Investment Calculators /
Pivot Point Calculator /
Market Profile Generator /
Fibonacci Calculator /
Mailing List /
Advertise Here /
Articles /
Financial Terms /
Brokers /
Software /
Holidays /
Stock Split Calendar /
Mortgage Calculator /
Donate
Copyright © 2004-2023, MyPivots. All rights reserved.
Copyright © 2004-2023, MyPivots. All rights reserved.