Looking to sell ?
This 1047 - 1050 area..lots of volume firing off up here....good day for a gap fill...
LOL sorry about the strange sounding post been up trading since 4:30 and out of coffee and its raining here about to put me to sleep.
LOL!...BEEN THERE ,DONE THAT!
Dang, sorry I missed the fun this morning ... was at the doc who was running an hour and a half behind as usual. Nice trade Bruce ... heck of an entry AND exit on that long trade! I need to visit your room more often Kool ... like the chart analysis!
quote:
Originally posted by BruceM
long at 57.50 after the probability of yesterdays low and the minus 4 hitting...61 -62 even more critical now that "air" has formed there...so that is initial target....
Good trade Bruce!
usually an entry like that doesn't get targets as it is "TOO GOOD"...but we all can do the math and have our old friend the minus 8-10 area.....yesterday is was the plus 8 - 10 area.....Kool had his reasons which is always COOL!!....not unusual to jerk around the open print after a big move day....I think it was Buzzy who said "IN trading just like in war you have the quick and the dead"......and " Dying to me don't sound like all that much fun" John Cougar..
That spike at around 10 a.m. worked it's magic so I had the upper volume zone of the 1070 from yesterday and then that 61-62 volume spike to use as a magnet.....the 70 never hit and that cost me three points in profit on last contract...I lost 3 points to try and gain one so that always sucks....can never fix that problem...
That spike at around 10 a.m. worked it's magic so I had the upper volume zone of the 1070 from yesterday and then that 61-62 volume spike to use as a magnet.....the 70 never hit and that cost me three points in profit on last contract...I lost 3 points to try and gain one so that always sucks....can never fix that problem...
no apolgees needed Joe... ur a real Traders, trader......u have a true passion for this stuff.....now go get some sleep or play with the kids....I'm watching my little girl "creep" across tthe floor....she almost does the full crawl.....last kid for us so I'm trying to enjoy all these moments
quote:
Originally posted by CharterJoe
LOL sorry about the strange sounding post been up trading since 4:30 and out of coffee and its raining here about to put me to sleep.
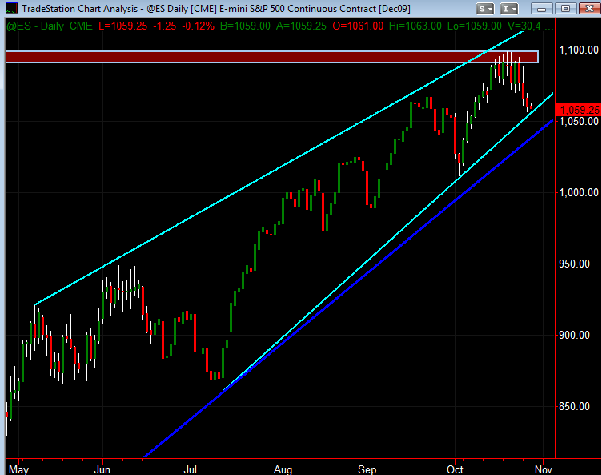
Got a daily ES for some perspective with a few trend lines ... noticing Tuesday traded down near one of them at its low in the 1057 area with Wkly S2 at 1053 area and Daily S1 around 1055.
I'd also referenced earlier how this bull market's daily consolidations break DOWN for a couple to several days before resuming its move back up. Kool had some analysis that this may be deeper than what we've experienced so far in the bull run since March.
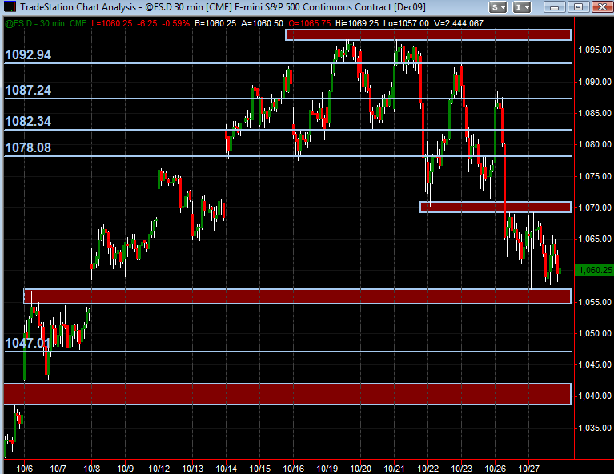
The 30 min chart has a zone I've drawn that's a daily gap of potential support in 1055-1057 area. This corresponds with the pivots and trendlines from the daily chart mentioned in the first paragraph. Next semi-minor price action support around 1047 with another unfilled gap below that at 1038.50-1042.50 .
On the upside, I have 1069-1070 as significant potential resistance with the next minor resistance at 1078. These prices and zones are drawn in on the Daily and 30min charts below.
It depends on how price acts when it reaches one of these "inflection" areas, as the day unfolds, as to how it might assist in mapping out a trade entry or exit (long or short). This is simply my market map for myself coming into the trading session. Will also take into account the Hi/Lo of overnight trading.
Open to any feedback, additional analysis and charts!!
I'd also referenced earlier how this bull market's daily consolidations break DOWN for a couple to several days before resuming its move back up. Kool had some analysis that this may be deeper than what we've experienced so far in the bull run since March.
The 30 min chart has a zone I've drawn that's a daily gap of potential support in 1055-1057 area. This corresponds with the pivots and trendlines from the daily chart mentioned in the first paragraph. Next semi-minor price action support around 1047 with another unfilled gap below that at 1038.50-1042.50 .
On the upside, I have 1069-1070 as significant potential resistance with the next minor resistance at 1078. These prices and zones are drawn in on the Daily and 30min charts below.
It depends on how price acts when it reaches one of these "inflection" areas, as the day unfolds, as to how it might assist in mapping out a trade entry or exit (long or short). This is simply my market map for myself coming into the trading session. Will also take into account the Hi/Lo of overnight trading.
Open to any feedback, additional analysis and charts!!
I SAID A DAY GO IF 1033 DOESNT HOLD WE'LL LIKELY GET A TEST OF 1018-19.50.. STILL FEEL THAT WAY
Emini Day Trading /
Daily Notes /
Forecast /
Economic Events /
Search /
Terms and Conditions /
Disclaimer /
Books /
Online Books /
Site Map /
Contact /
Privacy Policy /
Links /
About /
Day Trading Forum /
Investment Calculators /
Pivot Point Calculator /
Market Profile Generator /
Fibonacci Calculator /
Mailing List /
Advertise Here /
Articles /
Financial Terms /
Brokers /
Software /
Holidays /
Stock Split Calendar /
Mortgage Calculator /
Donate
Copyright © 2004-2023, MyPivots. All rights reserved.
Copyright © 2004-2023, MyPivots. All rights reserved.