Monkey S/R Levels for 11/2/09
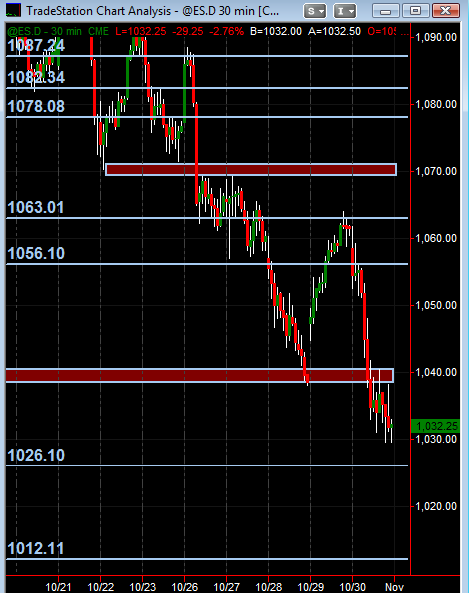
These price levels are what I've got based on multi-time frame S/R price action levels (drawn in on a 30min chart). Not as solid or comfortable with these as usual. But still will be my map along with Pivot Levels from this site in the background.
Open to any feedback and additionally, any and all analysis and chart postings from everyone!!
Click image for original size
Open to any feedback and additionally, any and all analysis and chart postings from everyone!!
Also have 1051-1052 area as a potential minor level.
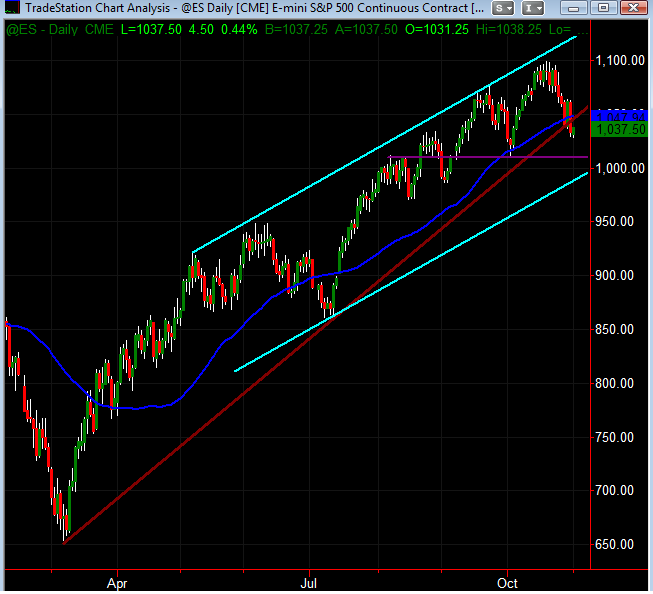
And I'd be remiss to not include the bigger pic of the daily ES chart ... with 50sma in royal blue ... price channel in cyan ... bull trend line in dark red ... also have purple horizontal line drawn in as daily price S/R level. Hope folks find this useful in some fashion.
Bruce, Kool, Joe et. al. (and any and all others) ... whadda ya got that you're looking at coming into Monday?
Click image for original size
Bruce, Kool, Joe et. al. (and any and all others) ... whadda ya got that you're looking at coming into Monday?
Looks about right... 1025 and 1041
Also, 1057 and 1008
Also, 1057 and 1008
my homeworks tells me support 1024, potential resistance at the daily pp=1041.75, 50d EMA=1042.25. I also have 1051-52 as a potential resistance level
GOTTA SLEEP ..BACK 10:30-11
I have the 40 - 42.50 as price zone longs will need to try and beat..other two are the 50 - 52.50 and 32.50 - 34 as per volume magnets from Friday...great matches with what you folks posted
cool day for volume magnets so far...
MONKEY, remember the weekend update numbers!...i do! (just in case!)
Hey Kool,
Around midmorning I saw your posted 1024 area you were looking at (assuming that's what you're referring to) ... nice call. I had 1025-1026 lines drawn on my charts back here at home from price action (the above charts were at my gf's last night). Like the synergy of that and the areas that Bruce, PT and phileo listed and described.
Good, usable stuff ... ended up buying that retest of earlier session low of 1026 just a little while ago ... bot @27.75 quick scalp out @30.75 (watched the 1min chart for entry) ... wishing I'd left a runner or two on now ... oh well. Only trade so far today. Couldn't get a read on what to do up near 1050 this morning ... so just watched. Maybe some of y'all found a reason and place to get short. If so, please share.
I'm guessing Bruce got short some up near the 1050 area this morn'. I had a price action line on my home charts at 1052 and Wkly Mid-Pvt was at 1050 ... know he was watching that area from a "volume magnet" approach.
no Kool...I also found them enjoyable but the challenge for me with those was always trying to remove the discretion from choosing the "correct" time period to look back. I have found that certain legs of market moves will attract high vertical volume at the same approximate price levels even on different days so price eventually spends more time there and that in theroy can pinpoint the same longer term profile volume point.....the 1061 area comes to mind.....that is long answer of "no I donot"
Emini Day Trading /
Daily Notes /
Forecast /
Economic Events /
Search /
Terms and Conditions /
Disclaimer /
Books /
Online Books /
Site Map /
Contact /
Privacy Policy /
Links /
About /
Day Trading Forum /
Investment Calculators /
Pivot Point Calculator /
Market Profile Generator /
Fibonacci Calculator /
Mailing List /
Advertise Here /
Articles /
Financial Terms /
Brokers /
Software /
Holidays /
Stock Split Calendar /
Mortgage Calculator /
Donate
Copyright © 2004-2023, MyPivots. All rights reserved.
Copyright © 2004-2023, MyPivots. All rights reserved.