ES S/R Map for 11-6-09
Btw Kool, interesting chart you posted on this page: http://www.mypivots.com/forum/topic.asp?TOPIC_ID=5075&whichpage=3
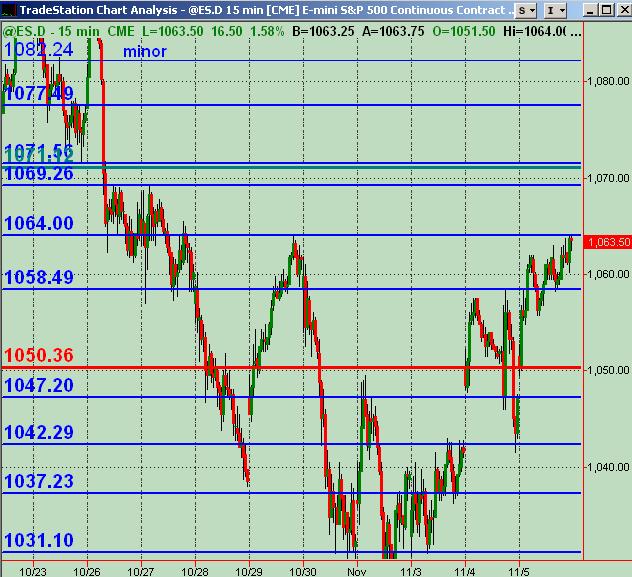
Here's what I've got for potential significant S/R price areas for Friday using a 15 minute chart. Blue=price action S/R ... Red line is Wkly Mid-Pvt ... Green(ish) line is Wkly R1 Pvt. Pleas offer any and all feedback and analysis and charts etc. !
Jobless report will be premkt ... so may be some interesting gyrations to watch.
Click image for original size
yeah, Kool ... was wondering about that myself ... the bid/ask indicator
WOW, JUST GOT FILLED... YEAH jOE ..THE RED IS 100 LOTTERS AND THE BLUE IS THE SMALL GUYS (US). ITS NOT AS GOOD AS YOU MIGHT THINK, BUT IS USEFUL. i USED TO THINK IF THE 100 LOTTERS WERE BUYING AND THE RETAIL CROWD WAS SELLING, THEN EVENTUALLY THE BIG BOYZ WIN! BUT THASTS NOT ALWAYS PROVEN TO BE TRUE!..IN FACT NOW I JUST USE IT AS A TREND INDICATOR..MOSTLY WATCHING THE BLUE RETAIL CROWD.. ARE THEY POSITIVE OR NEGATIVE... AND HOW STRONGLY? OVER 10,000 IS USUALLY A PRETTY GOOD TREND . O/N GOOD TREND DAYS IT'LL GO TO PLUS OR MINUS 60=70 THOUSAND!
FOR INSTANCE RIGHT NOW, THE BIG BOYZ ARE PLU7200 AND THE RETAIL GUYS ARE MINUS 4000 BUT COMING UP GOOD FROM AROUND MINUS 17000 EARLIER...ANALYSIS: MIXED.. JUST LIKE ME THIS BABY IS STILL TRYING TO DECIDE WHICH WAY TO GO. ITS PROBABLY WEAKLY POSITIVE , BUT WITH NO REAL POWER BEHIND IT YET.
WHAT I LOVE IS DAYS WHERE THEIR BOTH POSITIVE AND HEADING NORTH OF 10000, THEN YOU CAN BE PRETTY SURE ANY PULLBACK WILL BE QUICLY RETRACED AND EXCEEDED! OR THE OPPOSITE OF COURSE O/N NEGATIVE TRENDS
volume symetric so trying tosell the rallies...62 is magnet for me still
Thats ninja right? Could I get the code if you have time?
CHICKED OUT AT 1064.25 CAUSE IT HIT ME BUT THE DOM DIDNT SHOW VOL GOING DOWN ..AND IVE BEEN ONE TICKED A FEW TIMES THIS WEEK...SKITTISH!...UP 7.75 TODAY THO!...YEAH jOE IT IS BUT ITS A PROPRIETARY CODE FROM A FRIEND. IM HAVE NO IDEA HOW TO RETRIEVEIT!..IF YOU DO LET ME KNOW
FWIW THE ACTUAL ONE MIN PROJ DOWN IS 1062.75-1063.00
I THINK A GOOD FRIEND OF MINE PRESTWICK USES A SIMILAR ONE 50 LOTTERS VERSUS ODD LOTTERS (LESS THAN 10 RIGHT?) I MIGHT BE ABLE TO GET HIS CODE. HES VERY GOOD WITH COMPUTERS AND SUCH.
back to the bid/ask notice how strong the buying was (especially retail on the initial move up to 1069.25? maybe 16-17000. then the retail guys(us..lol) started selling strongly even going negative!
quote:
Originally posted by BruceM
hey Blue, can IB make vwap bands now or are those bollinger on you chart...? I haven't messed with it lately...thanks
Bruce
Yes the chart is from IB.
The red bars are volume bars by price. I didn't realize they had it.
Your references to volume areas twigged me to look.
the bands are ETB
which I think stands for envelope trading bands.
I wanted something that didn't increase in distance (width) with volatility as Bollinger and, to a lessor extend, Keltner do.
Emini Day Trading /
Daily Notes /
Forecast /
Economic Events /
Search /
Terms and Conditions /
Disclaimer /
Books /
Online Books /
Site Map /
Contact /
Privacy Policy /
Links /
About /
Day Trading Forum /
Investment Calculators /
Pivot Point Calculator /
Market Profile Generator /
Fibonacci Calculator /
Mailing List /
Advertise Here /
Articles /
Financial Terms /
Brokers /
Software /
Holidays /
Stock Split Calendar /
Mortgage Calculator /
Donate
Copyright © 2004-2023, MyPivots. All rights reserved.
Copyright © 2004-2023, MyPivots. All rights reserved.