ES S/R Map for 11-10-09
Here's what I've got for price action S/R levels ... blue lines. The red line is Wkly Mid-Pvt and greenish lines above it are Wkly S1 and S2. As always, open to any and all feedback and encourage posts including charts for analysis coming into Tuesday's trading day!
ES 60 minute chart:
ES 60 minute chart:
Click image for original size
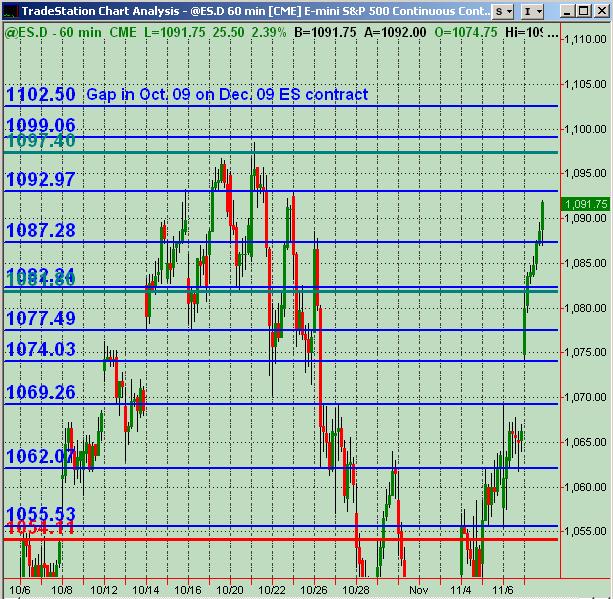
BTW ... the 1102.50 would be the closure of the daily RTH gap using the ES Dec 08 contract ... gap occured during Oct 08. Maybe I'm wrong, but I believe this is a more solid number (real) vs. compared to an ES "continuous contract" chart that would show it differently. Anyway, hope all made some $$ today ... even with my up bias, I still ended up in the red. Tonight and tomorrow are another day, right?
Looking forward to everyone's posts of analysis for tomorrow here!
Looking forward to everyone's posts of analysis for tomorrow here!
i wasn't very convinced about 1087 support until i went back to review the mid-Oct. value areas. looks like 1086-1087 is the value area from mid-Oct.
Today's session (Monday) was a bit unusual in that there was no 2-3pt retrace - it was even better than the Energizer bunny. Trend days like these are the most lucrative days, but i haven't yet figured out how to take advantage.
So the question comes down to this - will we see new contract highs tomorrow? While ES is more than capable of surprising everyone by doing what is least expected, I am not expecting new contract highs. After putting in 6 consecutive higher lows, is it that ludicrous to anticipate some profit taking to come into the picture at some point? My model/template for these past few sessions PA is Mar/07.
I am currently short Euro futures 1.4984, if i am not stopped out tomorrow morning, i will look to sell ES resistance
btw, tomorrow is turnaround tuesday, let's see what happens
86.25 and 83.75 are critical for me...I'd prefer buys until yesterdays high is broken....and sells if we rally up first in the Day session to get the short trade on back to the open......obviously failed yesterday......trends certainly are tough Phileo...glad that happened early in the week though so we get it out of the way......this is usually a good day for fades....a day after trend days
anyone on 87.50 longs?
Bias pivot number = 1089: Above Long / Below Short
Resistance : 1101, 1106, 1123
Support : 1089, 1081, 1073
After yesterdays smooth elevator ride, I expect today to be a bumpy ride, seat belts recommended ...
Resistance : 1101, 1106, 1123
Support : 1089, 1081, 1073
After yesterdays smooth elevator ride, I expect today to be a bumpy ride, seat belts recommended ...
short 92.25 ... relatively tight stop of 2 pts initially
scratched for 1 tick ... should have reacted back down quicker
on the 92.50's now...want the 88 retest
Yday was an interesting grinding trend ... don't see many of those in the ES ... so even tho biased long, didn't trade it effectively at all. Even on a jig up at the open was expecting some early morning weakness today and we're 30 mins into the session (can be a potential turning point sometimes) ... but still is strong. After a multi-day run up and yesterdays W/R closing near high, would expect a retracement of at least some of the day's bar. It may well be a seat belt day. For now will be watching for signs of weakness, espec. at resist areas ... biased short, but waiting for some erosion in buying w/regards to price action.
Blue - Entered Long on Monday Afternoon, added Tuesday, took profits Tuesday late afternoon and exited Wednesday morning.
Bruce - Combination of luck and patience. I try to figure out what day the turn is likely to setup, then use the usual intra-day trading tactics to find an optimal entry point. If I miss that entry or get shaken out, then I have to chase price as it's breaking out of value. In either case, once in I try to ignore the noise and hang on until the new trend breaks free and runs. As long as price is well behaved inside value or trending in my direction, I have no reason to exit.
Bruce - Combination of luck and patience. I try to figure out what day the turn is likely to setup, then use the usual intra-day trading tactics to find an optimal entry point. If I miss that entry or get shaken out, then I have to chase price as it's breaking out of value. In either case, once in I try to ignore the noise and hang on until the new trend breaks free and runs. As long as price is well behaved inside value or trending in my direction, I have no reason to exit.
Emini Day Trading /
Daily Notes /
Forecast /
Economic Events /
Search /
Terms and Conditions /
Disclaimer /
Books /
Online Books /
Site Map /
Contact /
Privacy Policy /
Links /
About /
Day Trading Forum /
Investment Calculators /
Pivot Point Calculator /
Market Profile Generator /
Fibonacci Calculator /
Mailing List /
Advertise Here /
Articles /
Financial Terms /
Brokers /
Software /
Holidays /
Stock Split Calendar /
Mortgage Calculator /
Donate
Copyright © 2004-2023, MyPivots. All rights reserved.
Copyright © 2004-2023, MyPivots. All rights reserved.