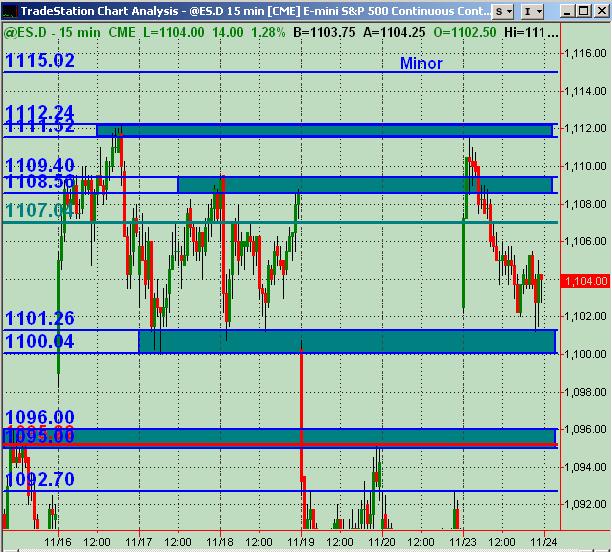
ES S/R Map for 11-24-09
Here's what I've got for Tuesday. Blue lines are price action S/R levels ... if filled in with Green(ish) color, helps better define S/R zone ... Green line is Wkly R1 Pvt ... Red line is Wkly Mid Pvt.
As always, looking for any feedback and others' analysis for coming into Tuesday's trading!
As always, looking for any feedback and others' analysis for coming into Tuesday's trading!
Click image for original size
Anything above 1108 is proven resistance. Today's morning rally was fully retraced back to the opening price and then some. There is still a gap up, so now the ball is in the bulls court. I am looking for a re-test of 1083 to see how bulls respond. I think there are still some trapped shorts below 1080 and if my guess is correct, that should put a limit on the downside. Range estimate is 1108 - 1083 for tomorrow.
Many traders that i am following are projecting a correction starting here and now. That being said, I am still mindful of potential upside to 1120.
Many traders that i am following are projecting a correction starting here and now. That being said, I am still mindful of potential upside to 1120.
Magnets are still the 1103 - 1105 but I'm now officially adding that 98.75 from yesterdays overnight as it was respected in the overnight once again in last nights move....the 1092 is still in effect also but not as impressive as the weekly close is down there too.....still a short bias for me
1084,
1077
1061..****
1084,
1077
1061..****
Res: 1105.50, 1106.50, 1114.00
Sup: 1103.50, 1101.50, 1089, 1081
Sup: 1103.50, 1101.50, 1089, 1081
triples at 97.75 and no break of the first hour range...
res 1108.25 ?
Emini Day Trading /
Daily Notes /
Forecast /
Economic Events /
Search /
Terms and Conditions /
Disclaimer /
Books /
Online Books /
Site Map /
Contact /
Privacy Policy /
Links /
About /
Day Trading Forum /
Investment Calculators /
Pivot Point Calculator /
Market Profile Generator /
Fibonacci Calculator /
Mailing List /
Advertise Here /
Articles /
Financial Terms /
Brokers /
Software /
Holidays /
Stock Split Calendar /
Mortgage Calculator /
Donate
Copyright © 2004-2023, MyPivots. All rights reserved.
Copyright © 2004-2023, MyPivots. All rights reserved.