Wednesday 2 Dec 2009
Thinking it could be very interesting.
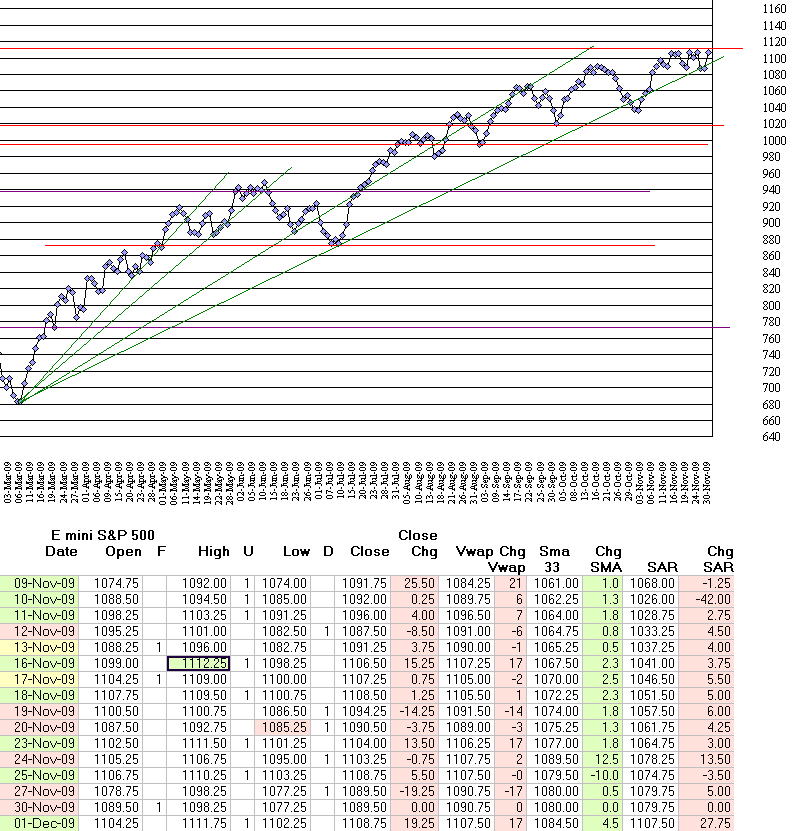
I posting because of the midpoint graph.
Haven't seen something bouncing its head like that.
divergence of 720 min CCI to recent price peaks leads me to think
they'll take out any stops just above 1112.25 eg. tp 1114.50 and then it'll drop.
If breakout upside of 1116 area suggests that 1123 - I'm not odd-on this but who knows with this crazy market?
{1121.00= 50% retracement of fall to 665.75}
Click image for original size
yea I'am watching that 1113 area
Emini Day Trading /
Daily Notes /
Forecast /
Economic Events /
Search /
Terms and Conditions /
Disclaimer /
Books /
Online Books /
Site Map /
Contact /
Privacy Policy /
Links /
About /
Day Trading Forum /
Investment Calculators /
Pivot Point Calculator /
Market Profile Generator /
Fibonacci Calculator /
Mailing List /
Advertise Here /
Articles /
Financial Terms /
Brokers /
Software /
Holidays /
Stock Split Calendar /
Mortgage Calculator /
Donate
Copyright © 2004-2023, MyPivots. All rights reserved.
Copyright © 2004-2023, MyPivots. All rights reserved.