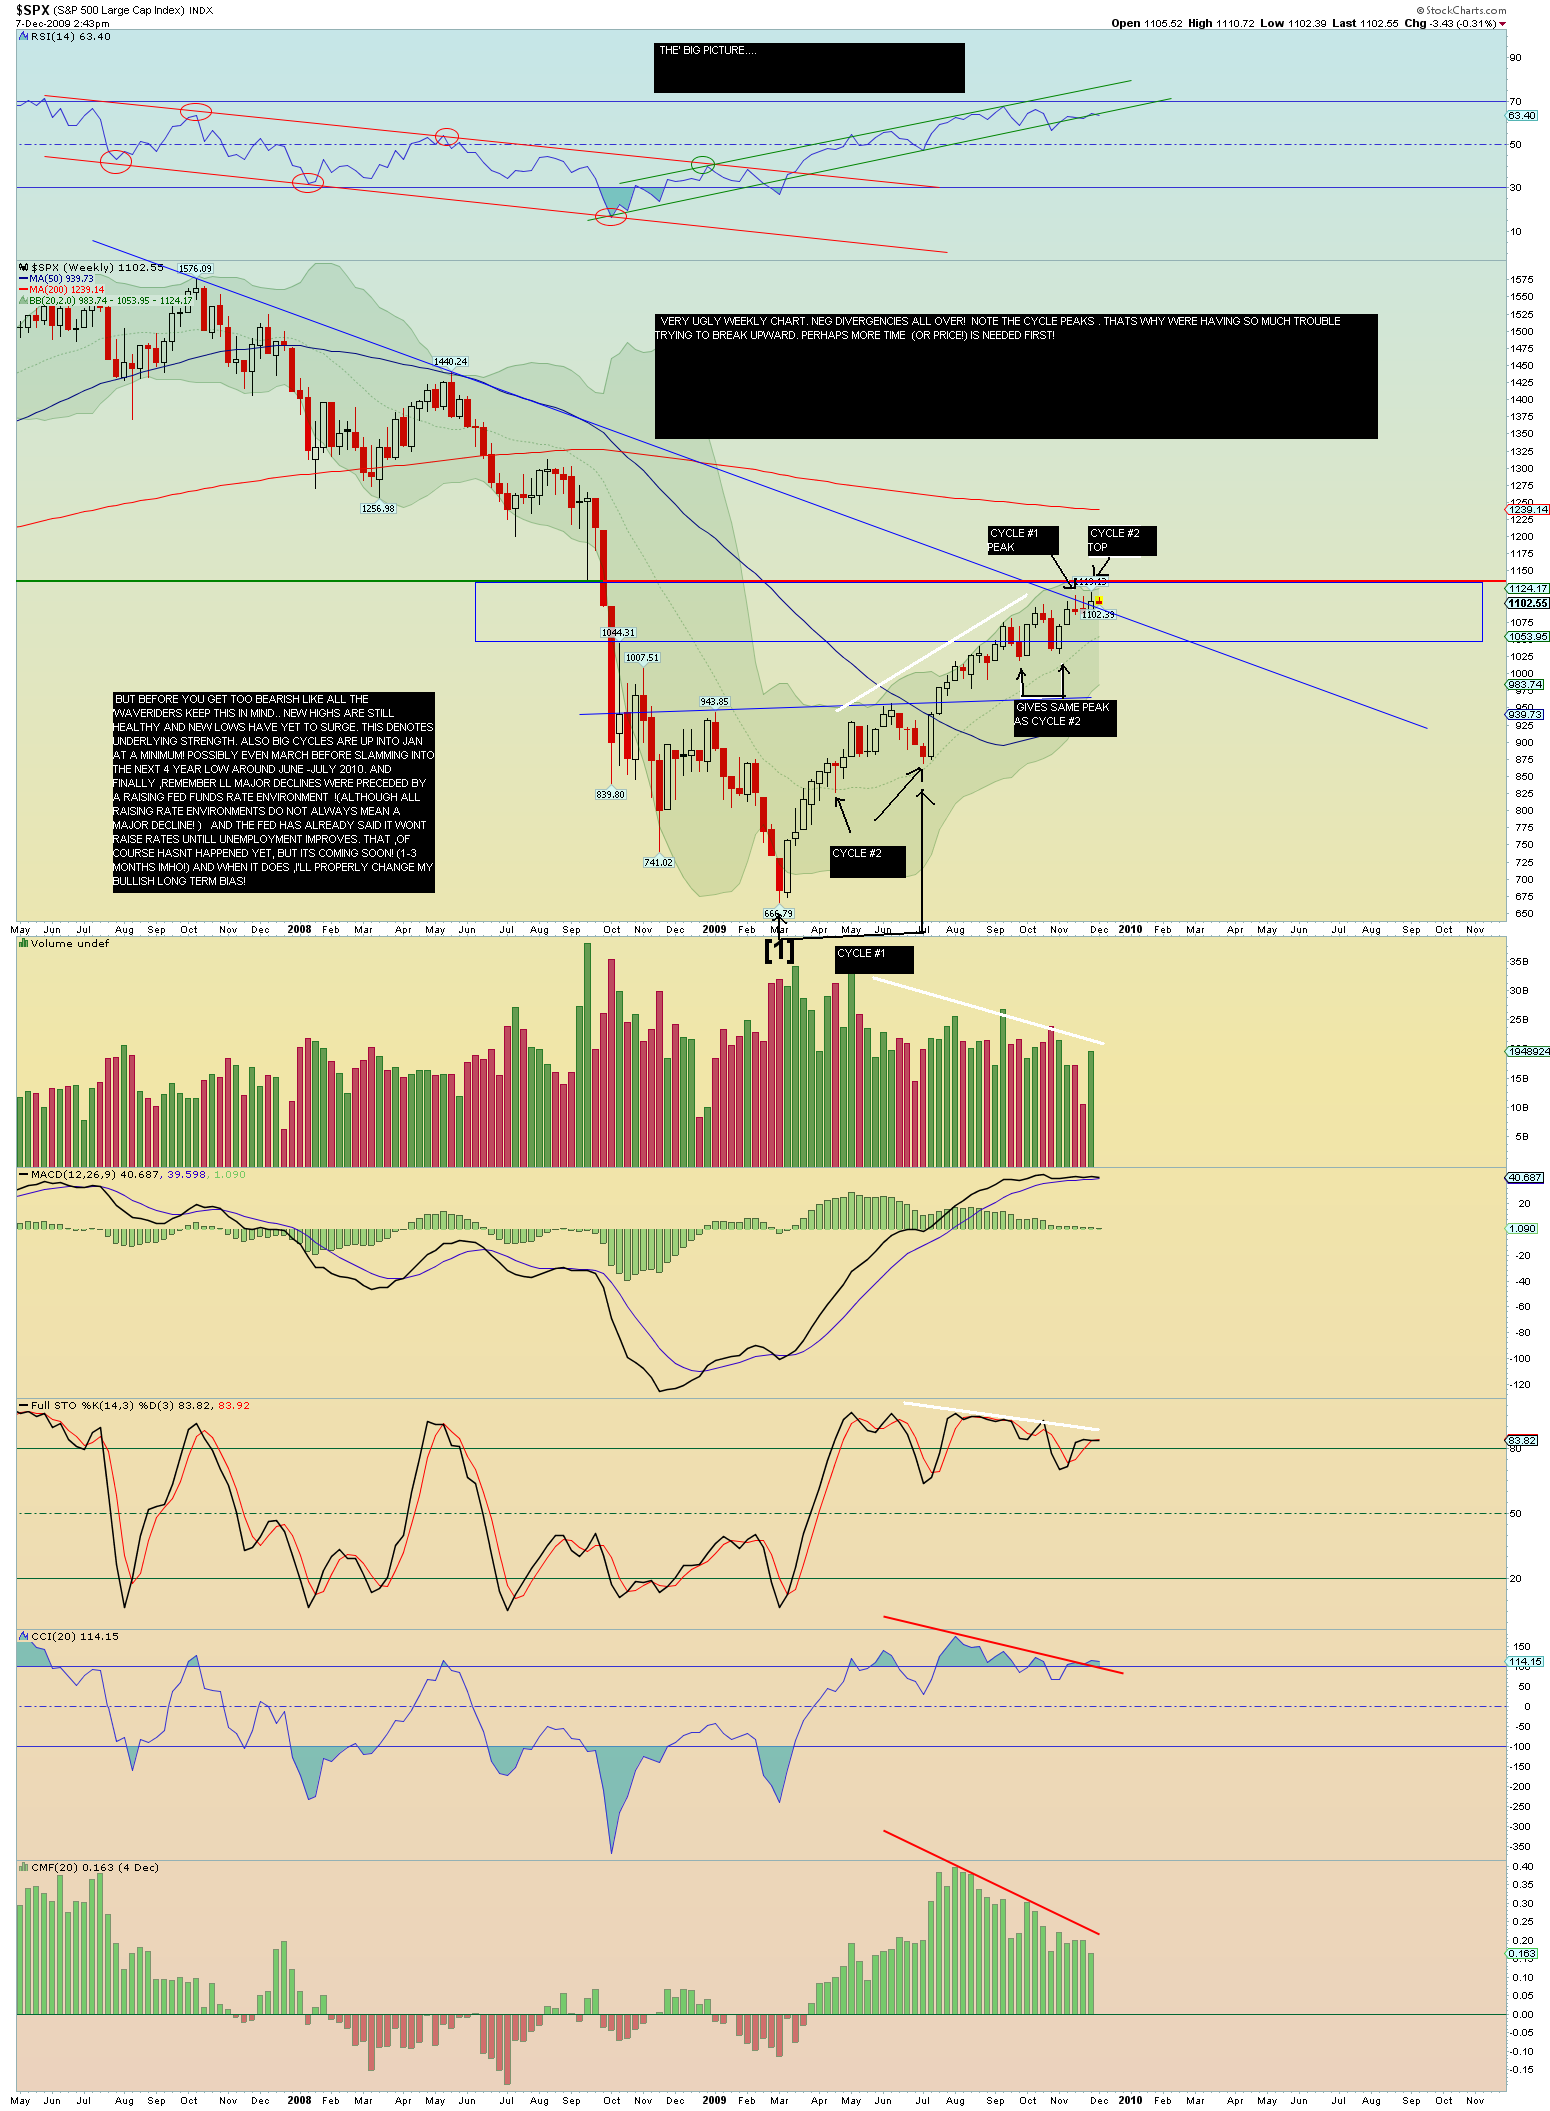
Longer term view
This is why im cautious here , but still bullish longer term (at least for now)...
Click image for original size
....thoughts? opinions? critisizems? all are welcome!
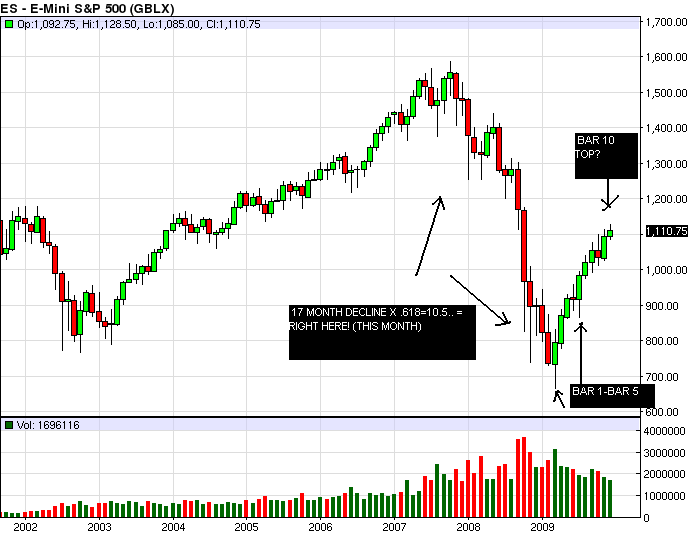
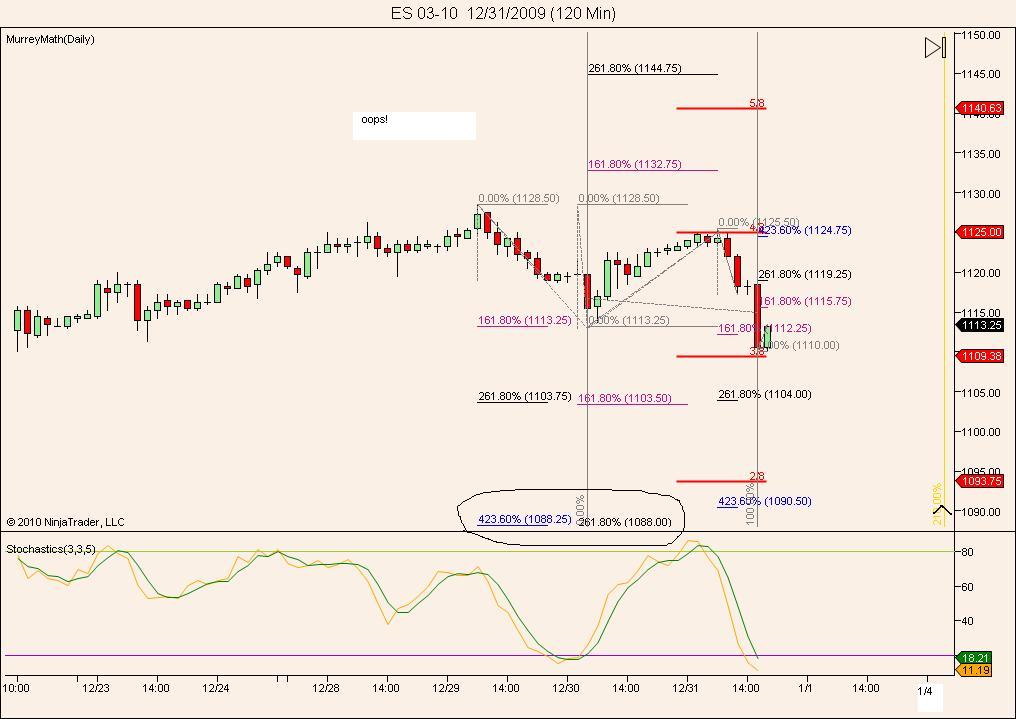
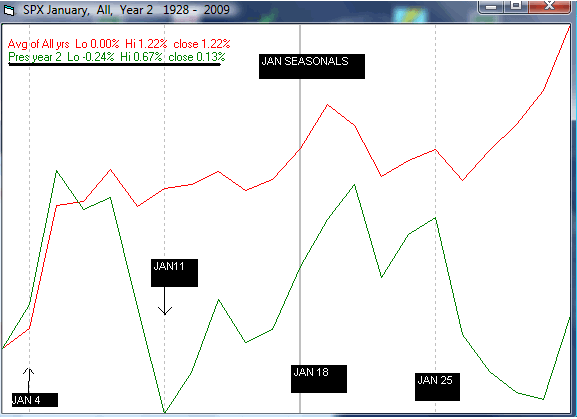
Well, here we go 2010! And so far we made it to 1109.75 (refer to above chart) . First some overview comments. I would describe myself as a bullish 'bear'. I believe that the same problems that caused the cyclical crash to the March lows were sufficient to lend credence to the theory that we started a secular bear trend back in 2000, which will not end for years yet. So im not looking for all time highs this year. quite the contrary, like many , im wondering where this up cycle will peter out! Back in March i postulated that 2009 would likely be a 'good year ' with returns of plus 10% or so! (there goes my guru status!..lol) . Im not looking for devastation in 2010, but a beginning of the tide to turn again ,nonetheless. AND THERE IS PLENTY OF REASON TO BE VERY NERVOUS RIGHT HERE. This year is the infamous (and widely followed 4 year low, so the question again becomes, where do we peak? I have resisted trying to pick 'the top' and will continue to do so, but but just be aware that an intermediate term decline of some sort will be seen , most likely starting in the first half of this year. Using kools tools , monthly cycles counting from the march low show a possibility of some sort of top right here! ...
Click image for original size
I continue to favor the March time frame however, and the bradley model seems to agree....
Click image for original size
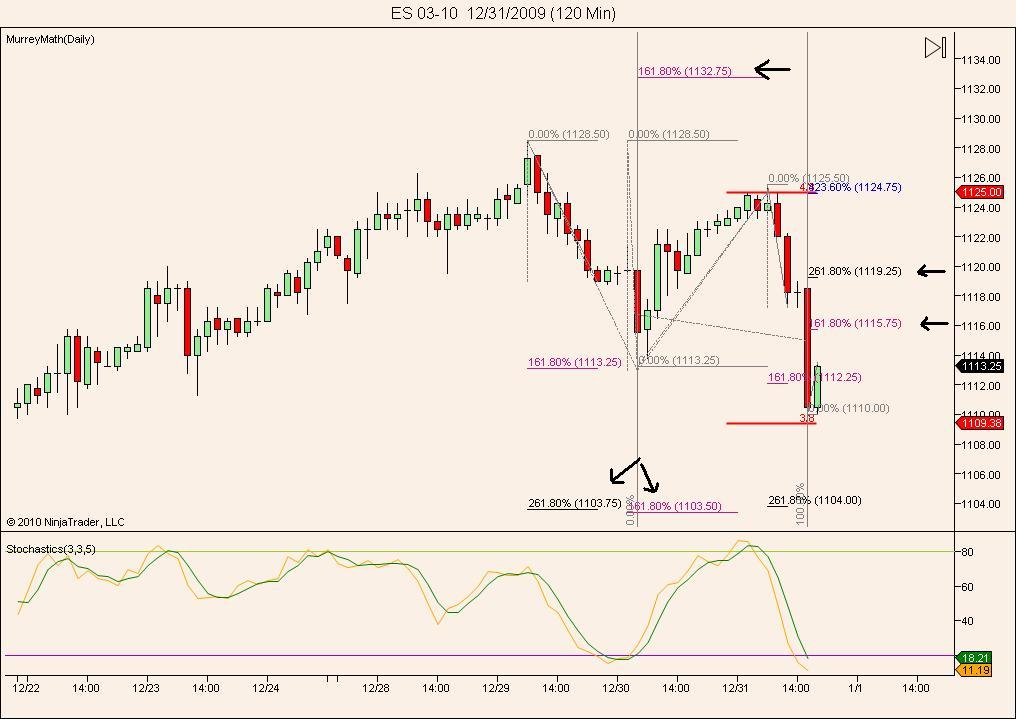
Regardless, for these and dozens of 'technical indicator reasons' (neg divergencies, sentiment, etc), its time for an investor(not a trader) to be very cautious and in fact i recently (at 1120 es) moved to 50%cash in my 401k! Now more to whats more useful to us as traders... as i pointed out , we hit the 1109 level shown on the above 120 min chart. Is that enough? I dont think so, but time will tell. after a rebound mon.(1115 or 1119?) im wondering if the 1103 area gets hit? Thats certainly a possibility. Or maybe , 1109 will be enough. We'll see. At any rate , heres hoping all of you have a great 2010!...
Click image for original size
SP500
S & P 500 Index
Daily Commentary
Our system posted a SELL CONFIRMED today. The previous BUY recommendation was issued on 12.21.2009 (10) days ago, when the index value was 1,105.3. Since then SP500 has gained 0.89% .
SELL-IF is confirmed by a black candlestick with a higher open and a lower close. The selling price is the previous close ( 1,126.4 ) according to the Rules of Confirmation.
Bears are getting stronger. The market hesitated a bit, but finally confirmed the bearish pattern with a one day delay. Though the market opened higher today, the day’s activity created a black candlestick that closed below the previous close. This is a valid bearish confirmation.
We hope that you sold this index . Your important benchmark was the previous close. You were supposed to watch the session carefully, feel its bearish tendency despite the higher opening and sell your shares after making sure that the prices stay below the previous close.
If you sold, keep away from this index until the confirmation of a new BUY-IF signal. What to do if you did not already sell? Maybe, you did not have time to follow the session or you simply delegated the delicate job of confirmation to us. Well, it is a bit late, but not too late. You may still find suitable prices for selling your shares in the following sessions.
The market is an inviting one for short-sellers. Risk lovers may now go for short sale.
Data provided by: End of Day Data
SELL
CONFIRMED
1,115.1
-11.320 -1.00%
Candlestick Analysis
Today’s Candlestick Patterns:
Black Candlestick
Candlestick Pattern (courtesy American Bulls)
PS: I forgot to show that in the next 3 days or so, should 1103 give way, then the next logical zone for a significant rebound would be a test of the 50 day mov avg around 1090, or as Kools tools has it..1088...
Click image for original size
Great posts, kool!
Kool, you always provide specifics and rationale for what your expectations are for the market based upon analysis that you lay out here on your charts and postings. I've found lots of value in that and always appreciate your contributions.
GREAT CHARTS here! The SP has had its run up and been in a well defined sideways trading range where price poked its head up above the top end of the range and fell back in on the daily chart.
I've switched to trading more individual stocks during the past couple of months but see the market as intermediate-term toppy. Looking at the technicals I follow are mixed which leads me to anticipate nothing in the way of a strong move/run up or down. It looks like continued range trading to me.
There'll be some stocks that offer high probability for long and short runs ... but I'm seeing the overall market as sloppy sideways with fakeout-breakouts on the daily without much follow thru.
Your thoughts?!?
great points, Monkey, but i wonder if the recent 'sideways' correction is simply the markets way of 'lulling' us to sleep! when my larger cycles are off, as they are want to do, its usually by 2 bars...March! Though longer term charts flat out look 'dangerous' to me, i actually lean more to shorter term charts which seem to allow for one more good push up. New highs and new lows have not reversed yet, and bull markets die hard. If indeed a 'major top' is in store it is generally a process that takes some time to develop. Have you noticed the subtle shift in how investors are beginning to interpet the continuing favorable economic news? First it was giddy enthusiasm with each unemployment and housing relief.... now suddenly jobless claims improve and the market sells off(as expected) . I said long ago that you would know the top is near when suddenly investors begin worrying about the fed raising rates due to an improving economy, even though by most estimates thats 6 or more months away! At any rate, for all these reasons, im not sure the past 2 months mish-mash coninues! (as a trader, i sure hope not!)
Click image for original size
OOPS , FORGOT! chart courtesy of Micheal Burke
Click image for original size

Emini Day Trading /
Daily Notes /
Forecast /
Economic Events /
Search /
Terms and Conditions /
Disclaimer /
Books /
Online Books /
Site Map /
Contact /
Privacy Policy /
Links /
About /
Day Trading Forum /
Investment Calculators /
Pivot Point Calculator /
Market Profile Generator /
Fibonacci Calculator /
Mailing List /
Advertise Here /
Articles /
Financial Terms /
Brokers /
Software /
Holidays /
Stock Split Calendar /
Mortgage Calculator /
Donate
Copyright © 2004-2023, MyPivots. All rights reserved.
Copyright © 2004-2023, MyPivots. All rights reserved.