Phileo's Notes
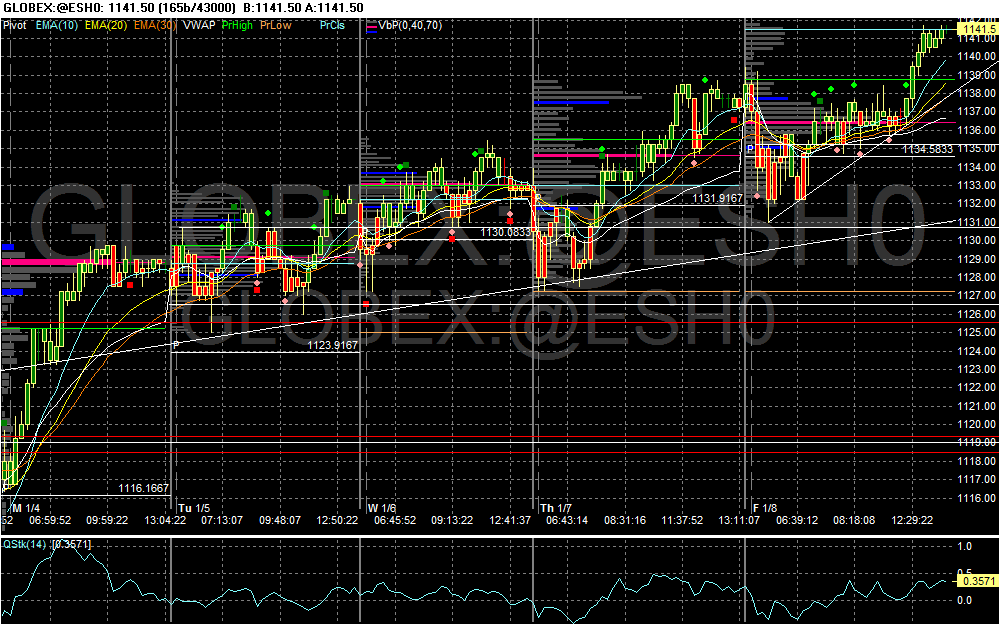
Here is the chart leading up to tomorrow`s NFP day Jan 8, 2010
A few notes:
- 4 consecutive higher lows (although today's low was equal to Wed's. low)
- US Dollar Index has been trending higher since Tues.
- ES has been stronger than, and thus leading NQ higher this week.
- Dec31 was the successful test of the breakout from the prior 6wks of consolidation (1085 - 1112 range)
- Individual names (BAC, GE, GS) and sectors (XLE, XLF, XLI) have taken turns at providing leadership.
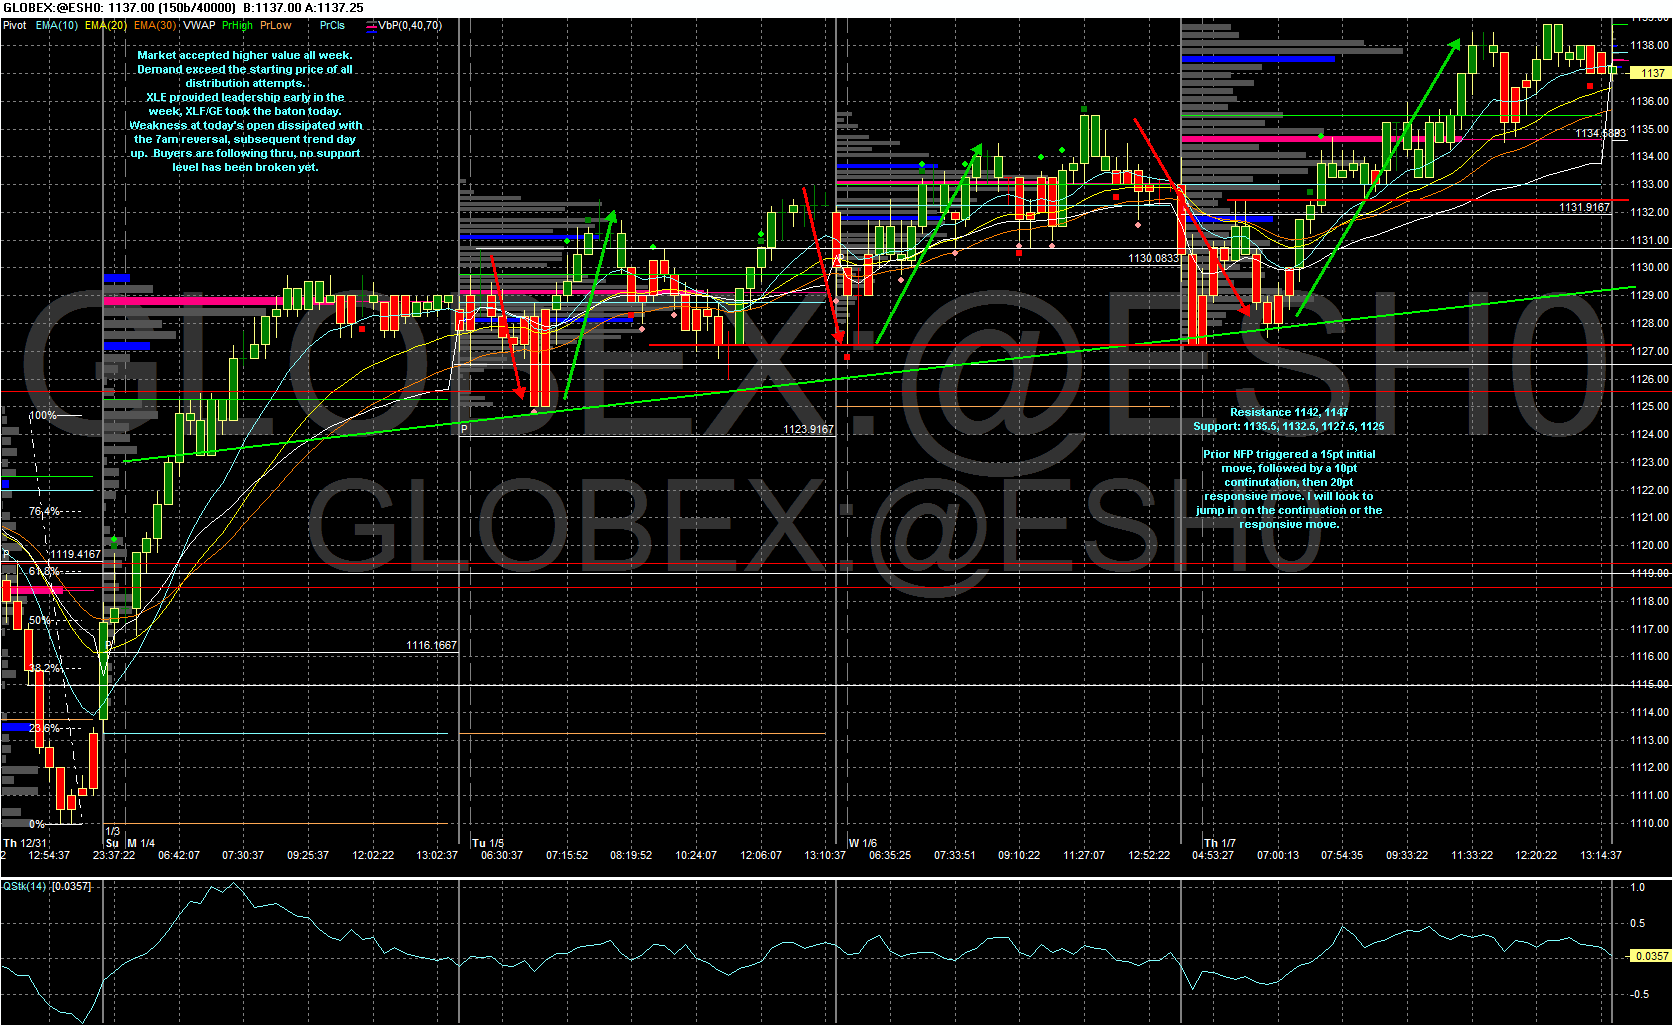
here's what happened once the NFP report came out:
Notes:
- initial move, small continuation, but muted responsive reaction move.
- market accepted higher values for 5th consecutive time
- unusually small range of 10.75pts given that it's an NFP day.
- breakaway gap up Monday, then 3 consecutive gap downs, followed by 4th gap down to open NFP day.
- +ve close the day before NFP day.
- response to NFP did not produce a change to the uptrend.
- 4 consecutive higher lows (although again, technically, Thurs' low was equal to wed's low)
- Friday's RTH session opened with a gap down. historical probabilities of a gap fill:
-> Opens between PP and S1: 79%
-> gap down after 3 consecutive higher lows prior: 72%
-> gap down to open NFP day: 68.6%
-> Fridays in general: 78% (should be lower if you count only friday gap downs)
The best plays were catching the continuation move:
Short 1135, target 1132
Catching the responsive move:
Long 1133 target 1135.5 (there were 3 opps to do this, with the 3rd. opp actually having further follow thru)
the small daily range, muted responsive reaction, and consolidation within a 3pt range for 4.5 hrs is indicative of a lack of participation by the big institutions still.
nice work here...thanks Phileo
thanks bruce. Just jotting some notes to help me understand the context and setup leading up to special days like NFP. Probably do something similar for FOMC days
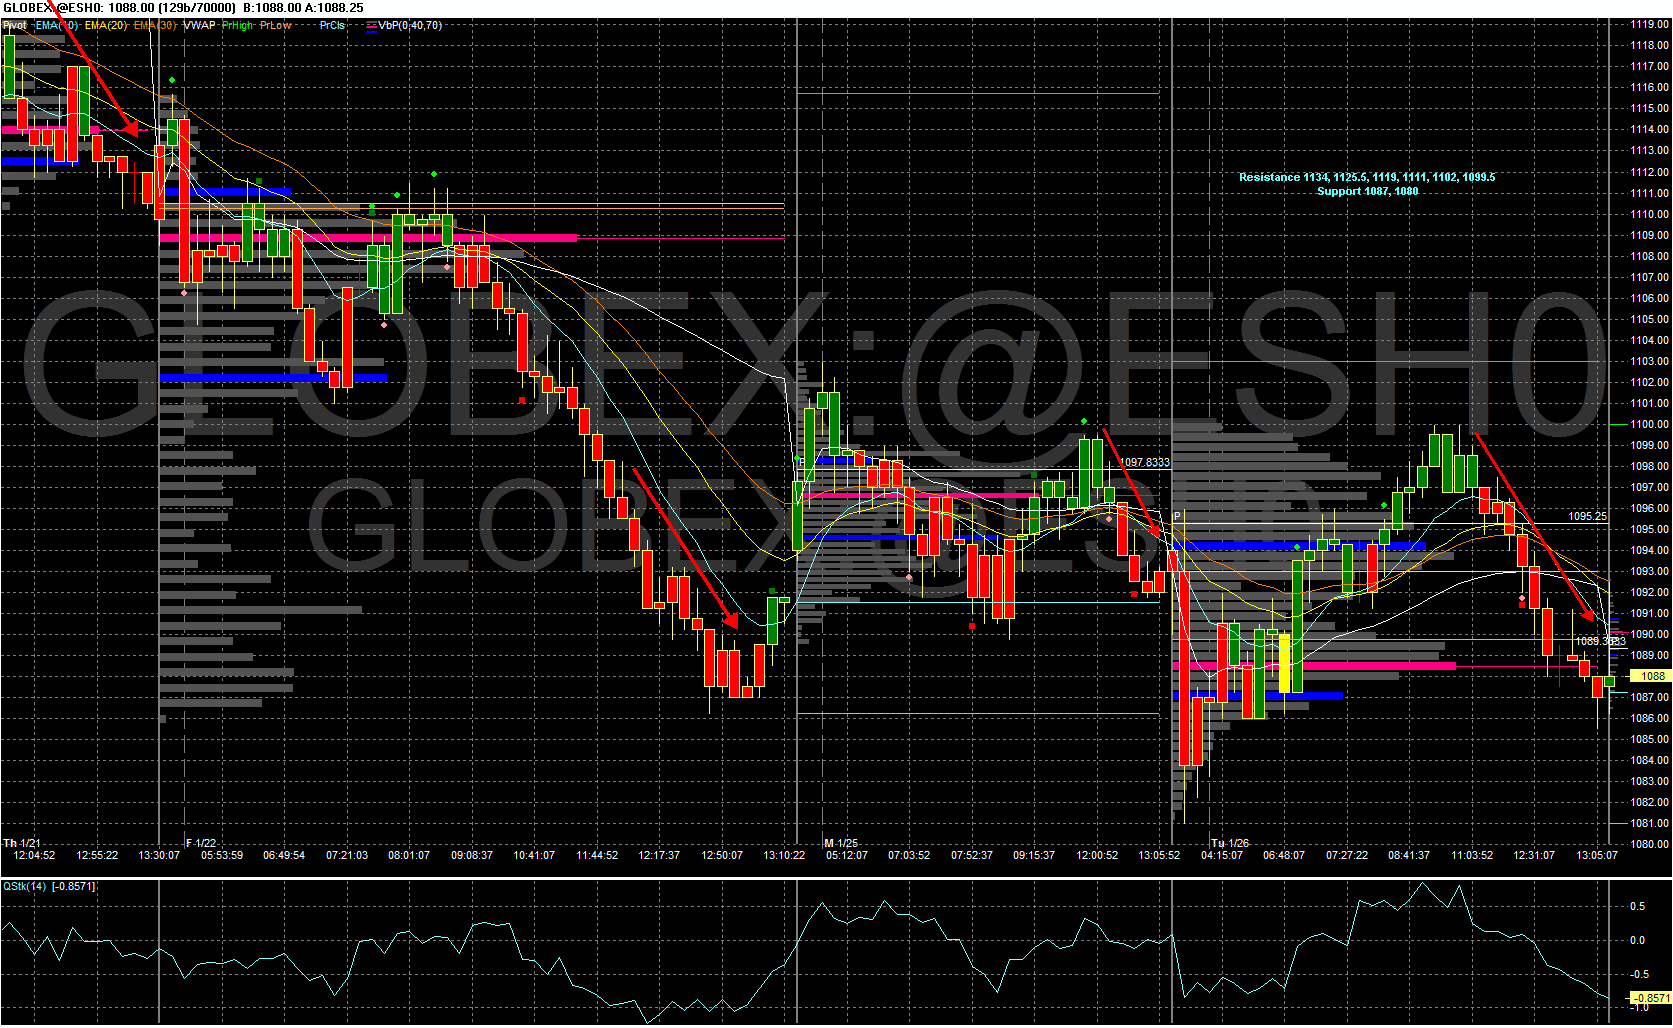
Here is the chart and context leading up to FOMC meeting:
Notes:
- 10 & 20d EMA are both pointing down, 50d EMA starting to rollover.
- 4th consecutive time where the bias was down in the afternoon session.
- individual leadership stocks all ran up on perception of good earnings, and then all sold off on earnings report (AA, INTC, GS, IBM, GOOG, BAC). AAPL bucked the "sell the news" bias in the morning session, but eventually succumbed to selling pressure in the afternoon.
- NYMO & 5d MA of NYAD approaching levels from where previous market rallies started.
- 1092 appears to be "not" fair value, meaning that relatively little trading has been done at that price. That could be a potential location to initiate a trade once the bias and trend has been established after the FOMC announcement.
The morning session should be relatively quiet and range bound.
The most unlikely scenario would be a drift upwards in the morning session followed by a breakout above 1103 post-FOMC.
The scenario that keeps popping up in my head is a reversal of the initial knee-jerk spike (spike down, then trend back up, or spike up, then trend back down). I will be looking for the signs of a reversal.
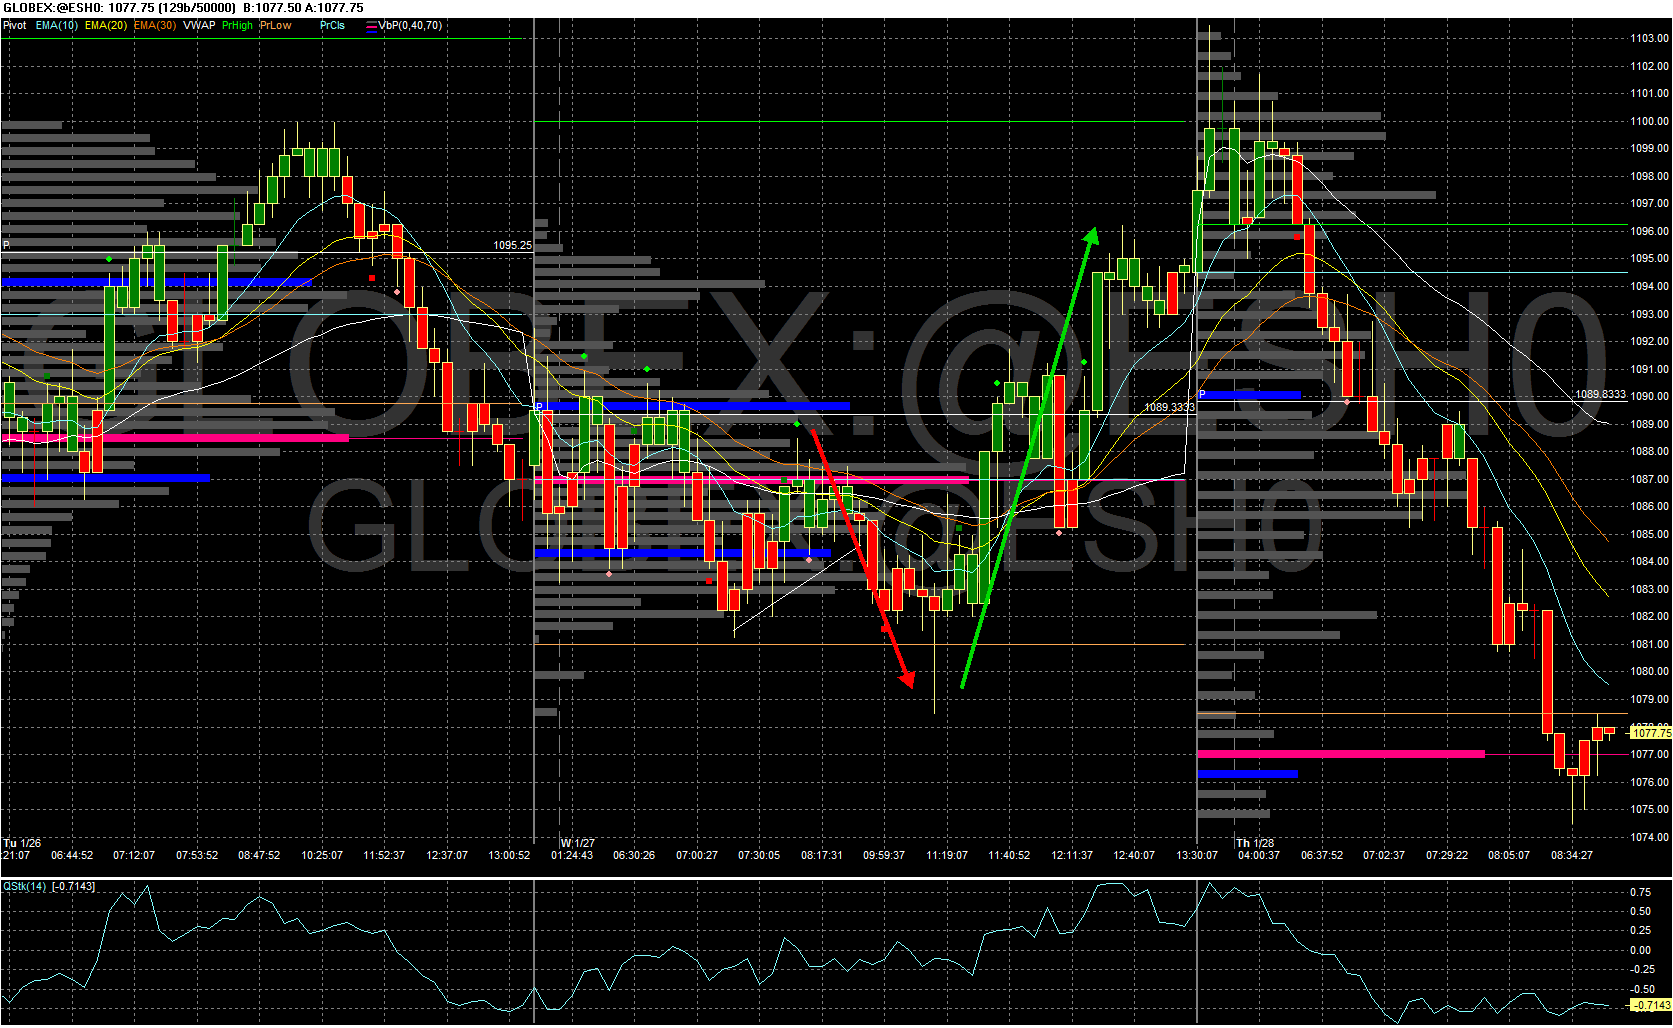
Here is the chart of what happened on FOMC day:
Notes:
- spike down, then reversal and trend back up.
- market accepted lower values until after the FOMC announcement
- 9pt range leading up to FOMC, 17.5pts range post-announcement
- gap down, followed a second, minor gap down to open FOMC day.
- doji close the day before FOMC day w/ a bearish upper tail.
- response to FOMC was positive, but did not produce a change to the daily trend.
- broke below 2-day range low prior to FOMC announcement
- FOMC day opened with a minor gap down (-1pt) not worth analysing.
The best plays were :
catching the reversal confirmation:
Long 1083, target 1091 (price tested 1082.5-1083 4 times before going back up)
Catching the follow thru move:
Long 1087, target 1094
the active responsive reaction indicated active participation by the big institutions.
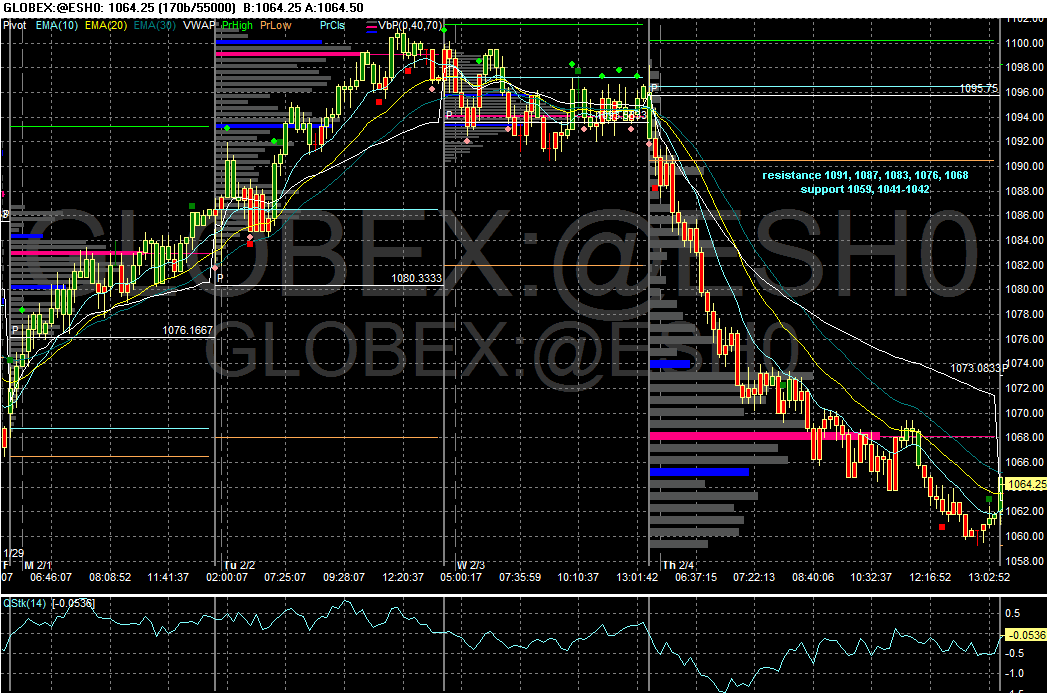
Here is the chart and context leading up to NFP day for Feb/10:
Notes:
A few notes:
- breakaway gap down, trend day
- 2 lower highs and 2 gap downs
- NR7 day followed by widest range in 46 days (39 pts)
- US Dollar Index has been trending higher for past 2 days.
- ES unable to sustain any moves above 1100, confirming bear flag consolidation this week.
- The last time ES exceeded 30pts was last day of Oct/09. That marked the end of the correction and the start of the the next leg up. However, this time the 50d EMA is flat and starting to point down.
- Individual names that used to provide leadership have broken down.
Current trend is down, I am not expecting the response to NFP to produce a change in the current downtrend.
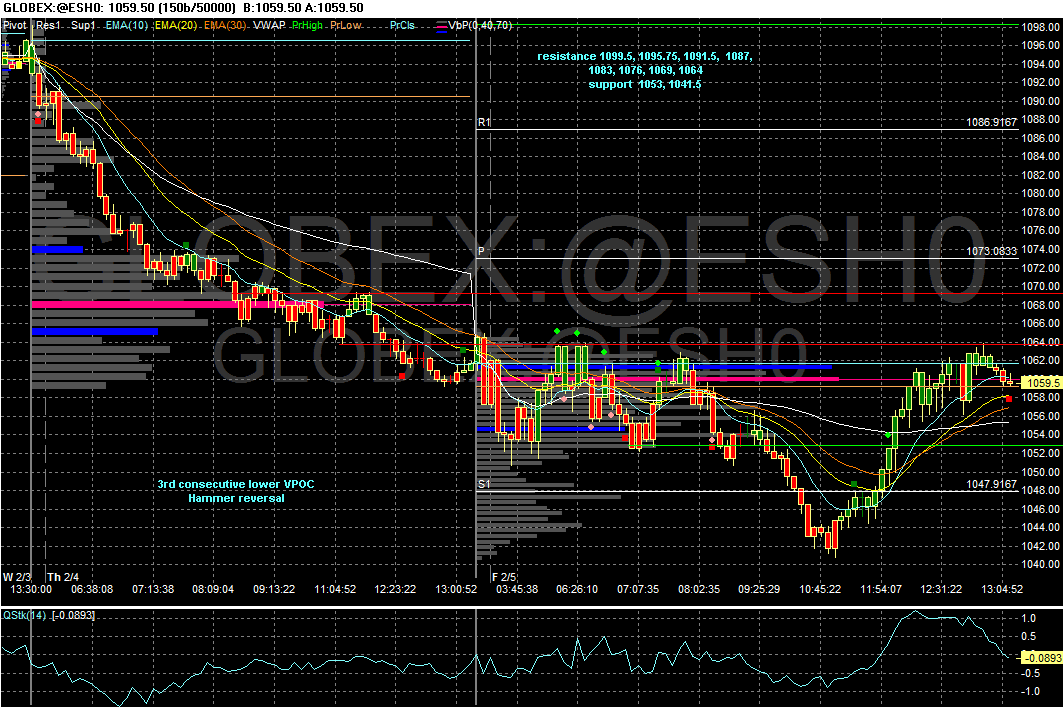
Here's what happened on NFP day for Feb/10:
Notes:
- 4pt initial move, small continuation (if you can even call it that) not really shown in the chart, but it stayed above overnight lows. responsive reaction move broke above previous day's close
- market accepted lower values for 3rd consecutive time
- post-NFP range 23pts, pre-NFP range 14pts.
- breakaway gap down Thurs (weak -ve close), 3rd consecutive gap down open NFP day.
- response to NFP while bullish, did not produce a change to the downtrend.
- broke last week's lows before reversing
- Friday's RTH session opened with a gap down. historical probabilities of a gap fill:
-> gap down to open NFP day: 68.6%
-> down gaps on the day of the Jobs report after a prior down day:
71%
-> opens between yesterday's low and yesterday's close: < 50%
- surprisingly enough, today's gap down did fill, reaching 1063 before rolling over.
The responsive move occurred before RTH, so the best plays were during RTH:
Short 1063, target 1056.5
Long 1055, target prior close (1061.75)
Short 1055, target 1041
Long 1042, target 1055, extended target 1063
With a hammer reversal, the bullish scenario for Monday would be :
Close > open, AND close > 1064
However, given that we are in a downtrend, I think a more likely scenario would be a close below today's close (1059.5). Monday's gap will determine the bias.
Originally posted by phileo
With a hammer reversal, the bullish scenario for Monday would be :
Close > open, AND close > 1064
However, given that we are in a downtrend, I think a more likely scenario would be a close below today's close (1059.5). Monday's gap will determine the bias.
Well, well, as it turns out, ES gapped up to open Monday`s session (1062), dipped and found responsive buyers at 1056. It was a no-brainer to play the gap fill for 2pts. I didn't find anything special about 1056, so could there be new participants entering the market?
ES is not only above 1050, but also above yesterday`s close. I'd like to see it maintain this bullish consolidation structure into the close. Also, the Euro has been acting mildly bullish - I see a series of higher lows 1.3625, 1.364, 1.365, 1.367
Anyways, I will be watching how the pros trade the close - will we get above 1064 ?
Here is the context leading up to March NFP report:
Notes:
- short term range bound between 1115.5 and 1124
- 10 & 20d EMA are both pointing up, 50d EMA starting to point up as well.
- past three selloff attempts have not broken the short term uptrend.
- individual leadership stocks showing bullish (albeit overbought) structure (GS, GOOG, AAPL). SMH, BAC and IBM showing hammer reversals that need confirmation.
- NYMO & 5d MA of NYAD starting to approach levels from where previous market pullbacks started.
- consecutive unfilled up gaps indicate that buyers are in control.
Bearish scenario:
false breakout above 1125, responsive selling appears in force, then selloff and close below 1114.
Bullish scenario:
False breakdown below 1114, responsive buyers appears in force, causing market to eventually accept 1125 (or higher) as fair value.
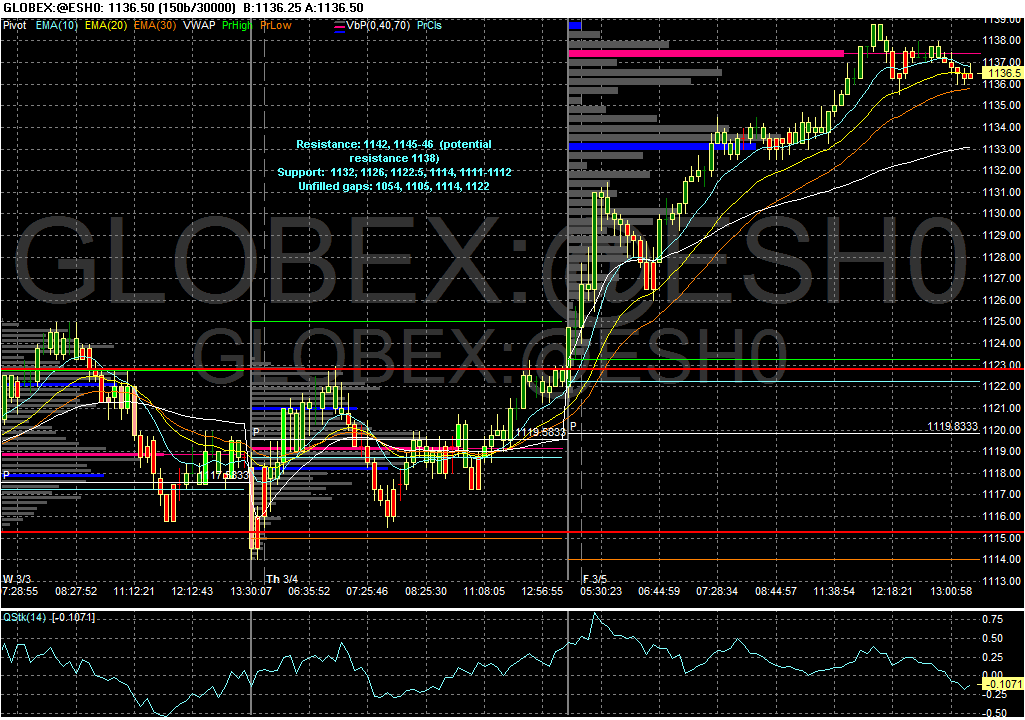
Here's what happened on NFP day:
Notes:
- 4pt initial move, very minor continuation move, then a pullback/consolidation before a 12pt responsive move in the same direction as initial move.
- trend day up.
- pre-NFP range 6pts, post-NFP range 12pts
- +ve close the day before NFP day, overnight GLOBEX bias was up prior to NFP announcement.
- range breakout after 3days where most of time was spent between 1116-1123.
- breakaway gap up Monday, then 3 consecutive gap ups, followed by another gap up to open NFP day.
- NYMO and NYAD have now reached levels from where previous market pullbacks started
- Friday's RTH session opened with a gap up which did not fill. historical probabilities of a gap fill:
-> Opening between R1&R2 : 62%
-> gap up to open NFP day: 64%
The best plays were:
catching the responsive move:
Long 1126.5, target 1134, ext.Target 1138
Long 1133.5, target 1138
I think Thurs. +ve close and the +ve GLOBEX overnight bias were good clues as to what the market wanted to do.
Looking ahead to Monday: we are staring at a potential double top if price breaks above 1142. However, if Jun/09, Oct/09, and Jan/10 are any indication, market tops typically take days to play out, and are usually accompanied by increased volatility.
IF this is a market top, we should see more +20pt range days next week.
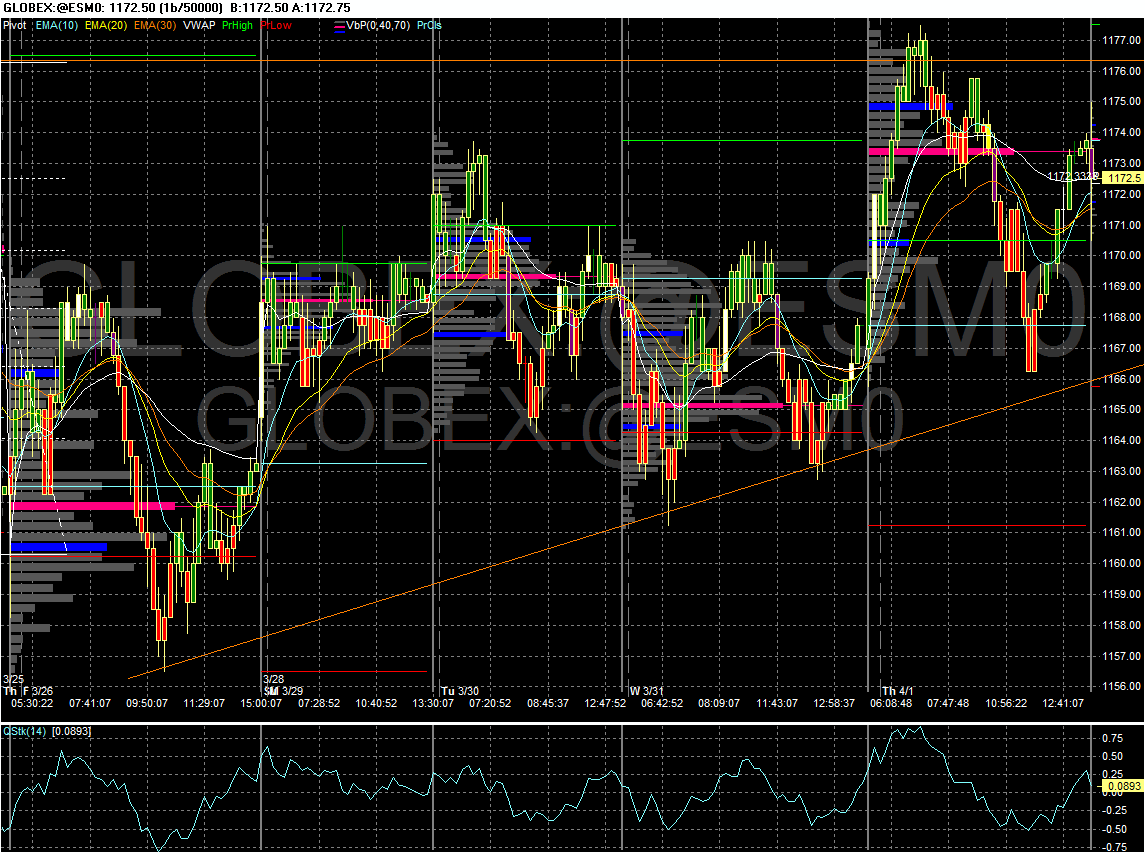
Here is the context leading up to NFP day (Good Friday)
Notes:
- market has been repeating a failed breakout pattern
- all dips have been bought
- 10 20d &50d EMA pointing up.
- uptrend for almost 2 months.
- many sectors starting to show sideways range bound movement.
- For some time now, NYMO & 5d MA of NYAD have been at levels from where previous market pullbacks started.
Based on the past 3 NFP's described here (small sample size duly noted), the biggest move (after the volatility stabilized) was in favour of the session bias the day before. Of course, there was that one NFP at the beginning of Feb/10 which carved out the hammer reversal that started this current uptrend. But even the Feb/10 NFP had a big drop which was inline with the +20pt drop the day before. It is possible we have another trend changing event on Monday.
Bearish scenario:
false breakout above 1178, responsive selling appears in force, then selloff and close below 1158.
Bullish scenario:
False breakdown below 1165, responsive buyers appears in force, causing market to eventually accept 1175 (or higher) as fair value.
Emini Day Trading /
Daily Notes /
Forecast /
Economic Events /
Search /
Terms and Conditions /
Disclaimer /
Books /
Online Books /
Site Map /
Contact /
Privacy Policy /
Links /
About /
Day Trading Forum /
Investment Calculators /
Pivot Point Calculator /
Market Profile Generator /
Fibonacci Calculator /
Mailing List /
Advertise Here /
Articles /
Financial Terms /
Brokers /
Software /
Holidays /
Stock Split Calendar /
Mortgage Calculator /
Donate
Copyright © 2004-2023, MyPivots. All rights reserved.
Copyright © 2004-2023, MyPivots. All rights reserved.
