Price Support Resistance
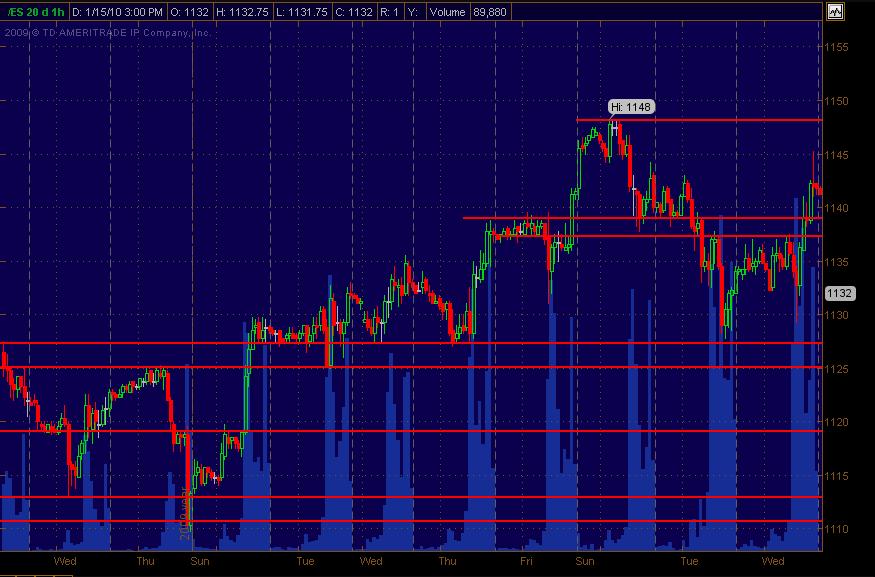
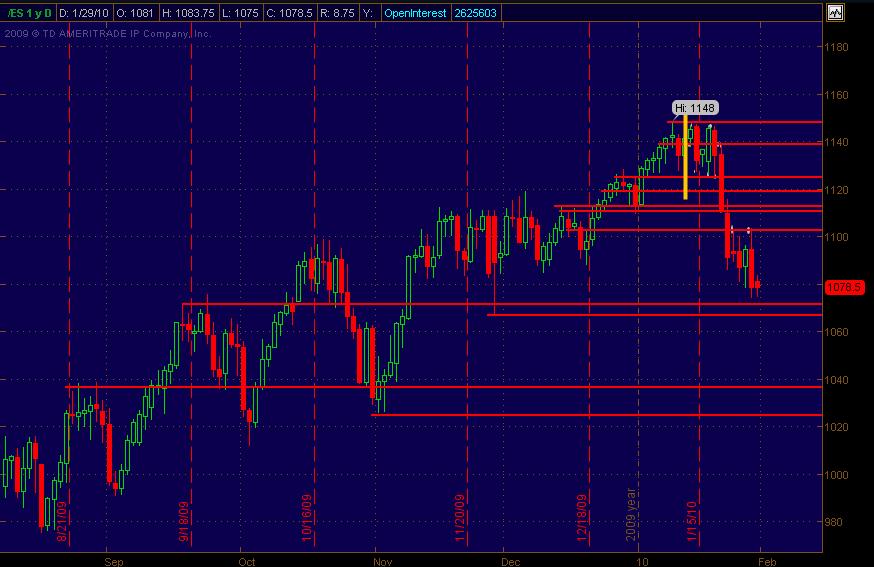
Main focus is currently on stock trades but always following the ES among other things for market analysis. I always draw in S/R lines on the ES. The first chart is what I drew in as of Wednesday's close. Simply eyeballed it and drew in the red horizontal lines. If 2 lines are within a couple of points of each other I view that as a "zone." And all S/R lines are in effect a tiny zone give or take a couple ticks.
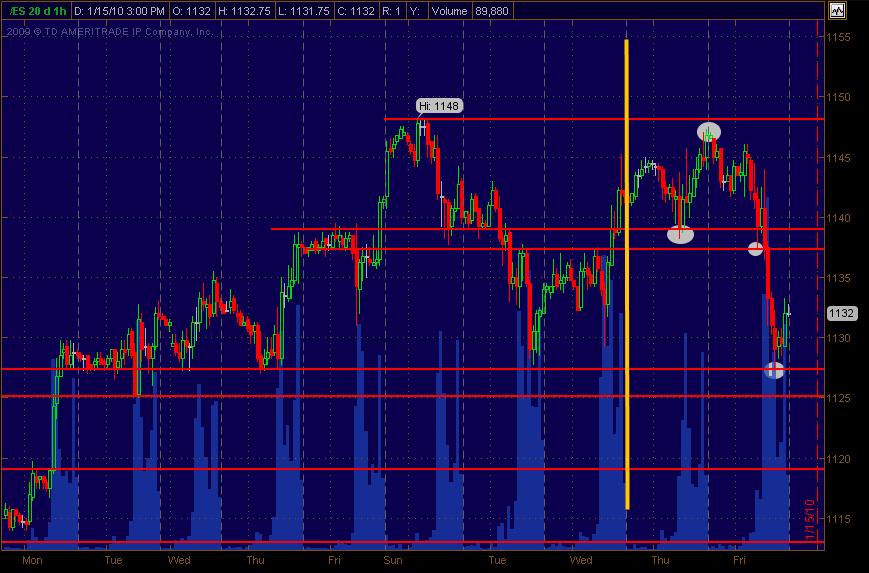
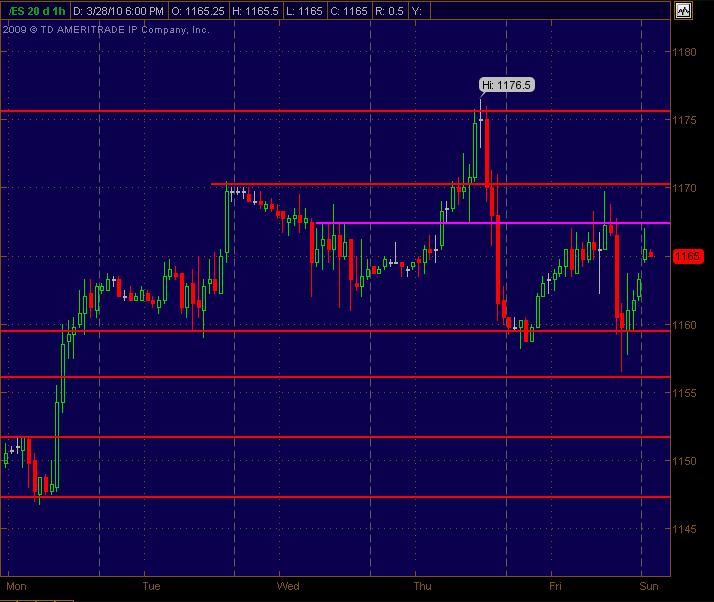
At the close Friday I nabbed another screenshot of the same chart where I'd drawn a vertical yellow line at Wednesday's close so that the following 2 trading days can be seen. It's an hourly chart. I circled in white the price swings where they react off of these areas of price S/R.
Just tossing this out since I see this all the time and could be incorporated or folded in to so many other strategeries or trading analysis and styles.
Would like to hear and see how others employ what I call PASR lines ... Price Action Support Resistance ... in their own trading with as much specificity and any xtra info. This sh@t's been around since before Dinosaurs and the Big Bang ... but thought it might be interesting to explore ideas of how it's effectively employed in the current market. Hope that makes sense.
The following 2 days of price action after Wednesday's S/R lines drawn.
At the close Friday I nabbed another screenshot of the same chart where I'd drawn a vertical yellow line at Wednesday's close so that the following 2 trading days can be seen. It's an hourly chart. I circled in white the price swings where they react off of these areas of price S/R.
Just tossing this out since I see this all the time and could be incorporated or folded in to so many other strategeries or trading analysis and styles.
Would like to hear and see how others employ what I call PASR lines ... Price Action Support Resistance ... in their own trading with as much specificity and any xtra info. This sh@t's been around since before Dinosaurs and the Big Bang ... but thought it might be interesting to explore ideas of how it's effectively employed in the current market. Hope that makes sense.
Click image for original size
The following 2 days of price action after Wednesday's S/R lines drawn.
Click image for original size
I'd been posting these S/R "price maps" on a semi-regular basis in past months. Hope my blather here about the phenomenon isn't too nebulous. Perhaps this has already been started and addressed to some extent on another thread ... if so, lemme know (Guy, Bruce et al). Anyway, hope this may be the genesis of some productive exchanges that translate into REAL trading results for all here.
Peace Love and Wild Monkey Flips!
MM
Peace Love and Wild Monkey Flips!
MM
Jeez, I seem to never collect my thoughts with everything I want to express in one single post.
When I was SOES trading 1000 share lots of stock in the late 90's and on into this century where we'd do 100 to 200 roundturns daily, there were services such as JS Services etc. that had price levels on the SP to work off of. There were others as well. And also I should say that drawing in S/R lines is very subjective, especially which ones a trader lends more strength or credibility to. Just adding more background and back-story. So how/where a trader draws in price S/R levels could/should be part of this posting conversation.
Jump in folks!!!
Here's a thread I rediscovered where I describe how I find and draw in S/R levels ... including input from others' postings. Am looking to take it to another level as described in above posts as to some of the most effective ways (and new ways) to employ it.
http://www.mypivots.com/Board/Topic/5175/1/support-resistance
MM
http://www.mypivots.com/Board/Topic/5175/1/support-resistance
MM
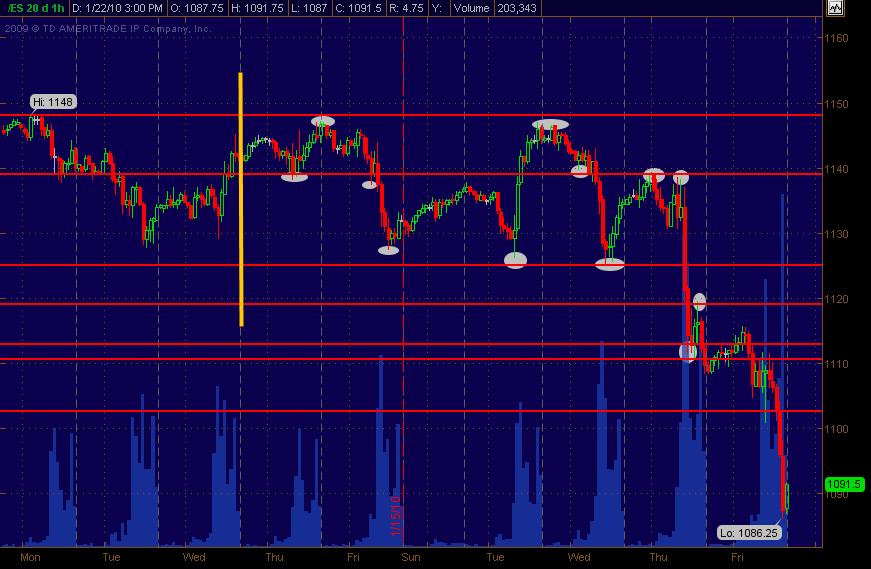
Just an update for S/R levels. This is the next few days of the same pic/chart ... with further "circled" areas where price reacted off of levels drawn in. Friday was the only "messy" day for the price levels. Open to any and all commentary.
Click image for original size
thanks MM....it's appreciated
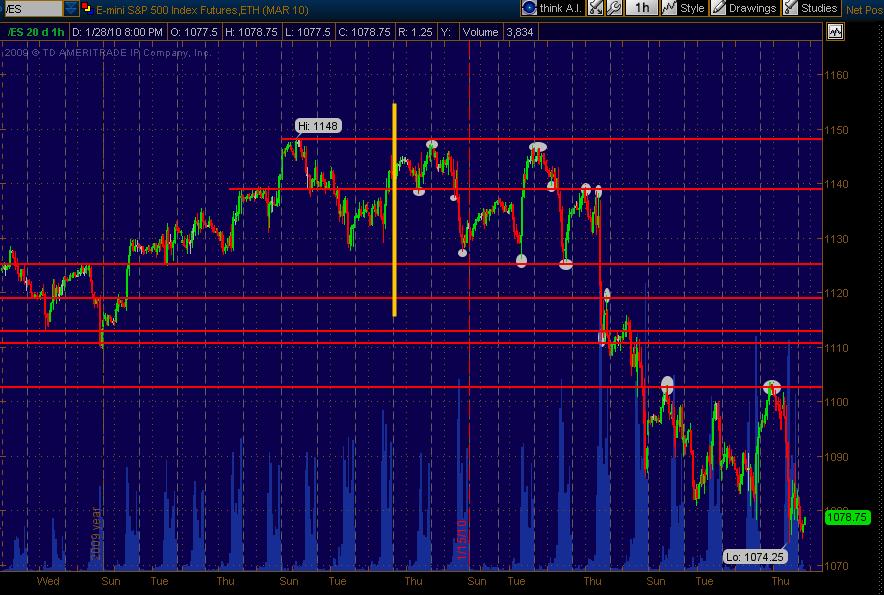
Same chart ... same S/R levels with a couple/few more days of price action. Would have updated with S/R levels working below the market ... but focusing on these lines (and nothing new) drawn in a couple of weeks ago or so. Just sharing an additional pic to what I'd posted above ... fwiw.
MM
Click image for original size
MM
We hear talk about having an EDGE in the market. If this isn't a true EDGE, then I don't know what is ... beyond an edge in money management, trading psychology and/or discipline. But based on visual observation of charts (and any indicators), this could be incorporated with other rule-based approaches to trading entry and exits. I would love some feedback on this. I do what I do with my own trading ... and this is the biggest component of analysis that usually plays a serious role in my trade decisions. I'm sure some folks could and have folded this aspect into other combined analysis in ways that perhaps increase the odds of a more profitable outcome than if not incorporated into an overall strategy. And perhaps to turn things around ... this could be the core and point of departure for crafting other analysis around ... whether with home grown indicators or MP or ... well, anything. Again, would love to have input to build a thread around this. Could be some good stuff!
MM
MM
Had these drawn in on a daily chart ... just adding more ... hoping there's value here for generating analysis and interaction!
Click image for original size
do you find it's best to use "all session" data when drawing your lines MM ?
Over the last few years I've found myself using both RTH and "all session" charts, looking at multiple time frames on both. I do tend to give a little more weight to the RTH though when looking for S/R areas. Obviously, gaps also show up better there.
"All session" charts can help confirm the RTH S/R zones and are even more important looking back at places where the so called "overnight" session takes out the prior RTH's daily high or low by a decent amount.
It's meant looking at more charts of the index, but it helps provide a better feel, visually, for where these S/R areas are and also offers insight into which may be more significant price levels.
One thing I have not done is to fold in volume as part of the analysis for finding S/R levels. So far, just price has always worked relatively well ... at least for the levels that I "see."
I do think that as we end up with more activity in a variety of markets with 24/7 trading that things will evolve, as always. The "all session" charts may become the primary or only bar charts worth looking at for S/R areas.
Here's an update of Price Action S/R levels for the ES coming into Monday 3-29-10. I looked at a bunch of daily equity charts and really wasn't turned on for many longs (or shorts) ... mixed. That's what I've seen the past few days fwiw. And the SP has been "sloppy" trading back and forth intraday for the past few sessions. (even though there have been some decent moves for trades).
Anyway, it still looks choppy (at least to me) now after such a strong and grinding run up the past few weeks ... even on low volatility. Hope this helps as a roadmap with some ideas. As always, open to any and all analysis and feedback.
Anyway, it still looks choppy (at least to me) now after such a strong and grinding run up the past few weeks ... even on low volatility. Hope this helps as a roadmap with some ideas. As always, open to any and all analysis and feedback.
Click image for original size
Emini Day Trading /
Daily Notes /
Forecast /
Economic Events /
Search /
Terms and Conditions /
Disclaimer /
Books /
Online Books /
Site Map /
Contact /
Privacy Policy /
Links /
About /
Day Trading Forum /
Investment Calculators /
Pivot Point Calculator /
Market Profile Generator /
Fibonacci Calculator /
Mailing List /
Advertise Here /
Articles /
Financial Terms /
Brokers /
Software /
Holidays /
Stock Split Calendar /
Mortgage Calculator /
Donate
Copyright © 2004-2023, MyPivots. All rights reserved.
Copyright © 2004-2023, MyPivots. All rights reserved.