Price Support Resistance
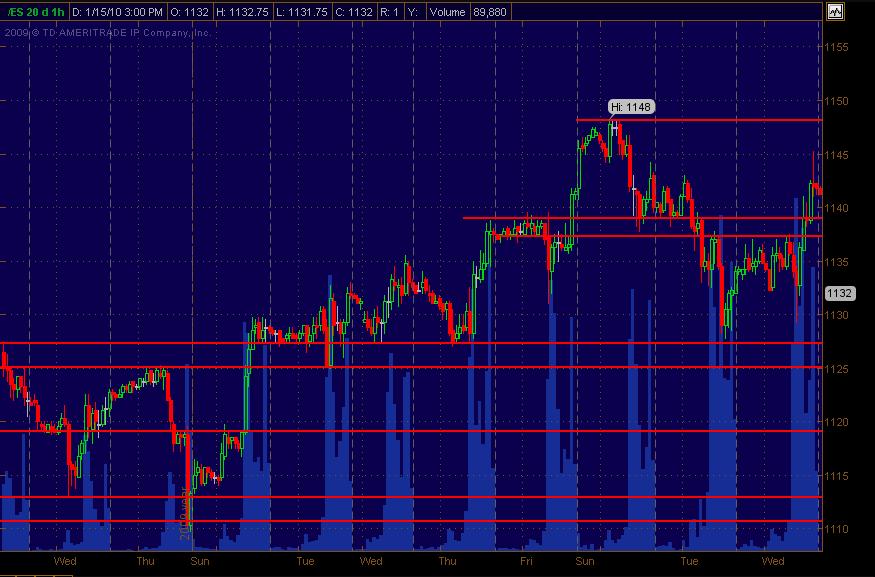
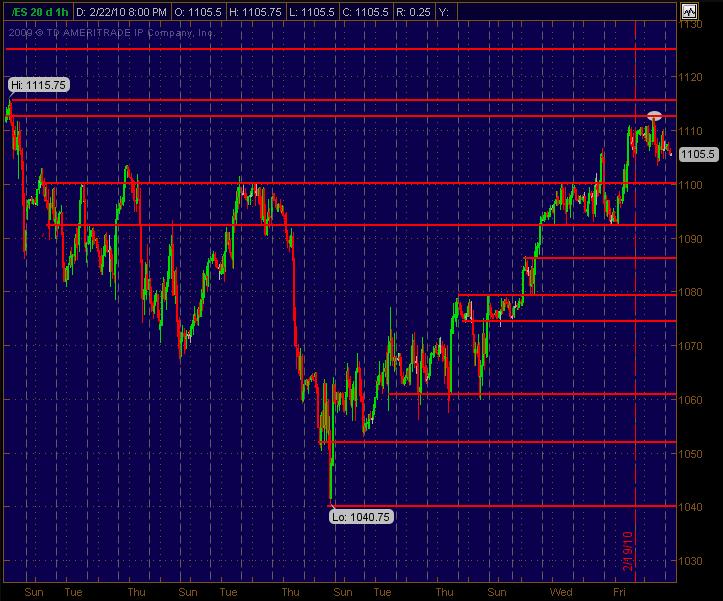
Main focus is currently on stock trades but always following the ES among other things for market analysis. I always draw in S/R lines on the ES. The first chart is what I drew in as of Wednesday's close. Simply eyeballed it and drew in the red horizontal lines. If 2 lines are within a couple of points of each other I view that as a "zone." And all S/R lines are in effect a tiny zone give or take a couple ticks.
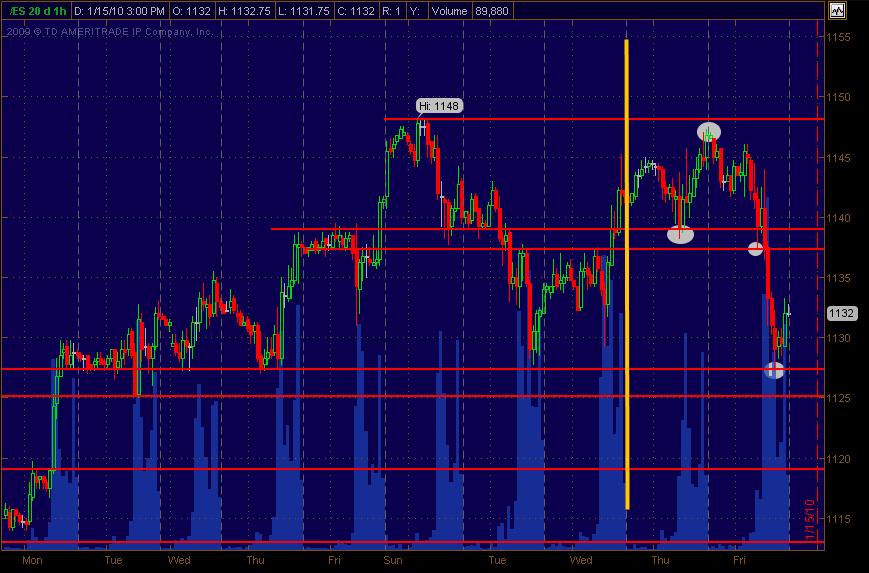
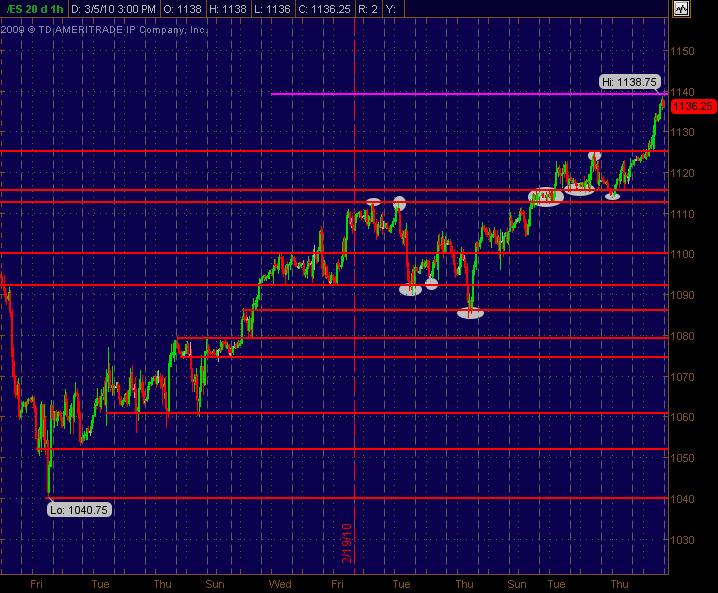
At the close Friday I nabbed another screenshot of the same chart where I'd drawn a vertical yellow line at Wednesday's close so that the following 2 trading days can be seen. It's an hourly chart. I circled in white the price swings where they react off of these areas of price S/R.
Just tossing this out since I see this all the time and could be incorporated or folded in to so many other strategeries or trading analysis and styles.
Would like to hear and see how others employ what I call PASR lines ... Price Action Support Resistance ... in their own trading with as much specificity and any xtra info. This sh@t's been around since before Dinosaurs and the Big Bang ... but thought it might be interesting to explore ideas of how it's effectively employed in the current market. Hope that makes sense.
The following 2 days of price action after Wednesday's S/R lines drawn.
At the close Friday I nabbed another screenshot of the same chart where I'd drawn a vertical yellow line at Wednesday's close so that the following 2 trading days can be seen. It's an hourly chart. I circled in white the price swings where they react off of these areas of price S/R.
Just tossing this out since I see this all the time and could be incorporated or folded in to so many other strategeries or trading analysis and styles.
Would like to hear and see how others employ what I call PASR lines ... Price Action Support Resistance ... in their own trading with as much specificity and any xtra info. This sh@t's been around since before Dinosaurs and the Big Bang ... but thought it might be interesting to explore ideas of how it's effectively employed in the current market. Hope that makes sense.
Click image for original size
The following 2 days of price action after Wednesday's S/R lines drawn.
Click image for original size
Appreciate the sharing RiskyB. I rank my S/R lines very similar to what you describe based on multiple time frame analysis. There's also the issue of RTH and all trading hours (ATH) as to what I look at and where I find and "weight" potential price levels. It'd be cool to see a chart or several charts of what you do to draw in your price action S/R levels here. Thanks for adding to this thread and I look forward to your next postings!!
nice on the 1091 MM...lots of volume came in there today....hopefully not from buyers..yet!!
Yeah, and the 5min chart pattern and action stayed strong continually showing strength ... and blew through 1091 ... bleh!
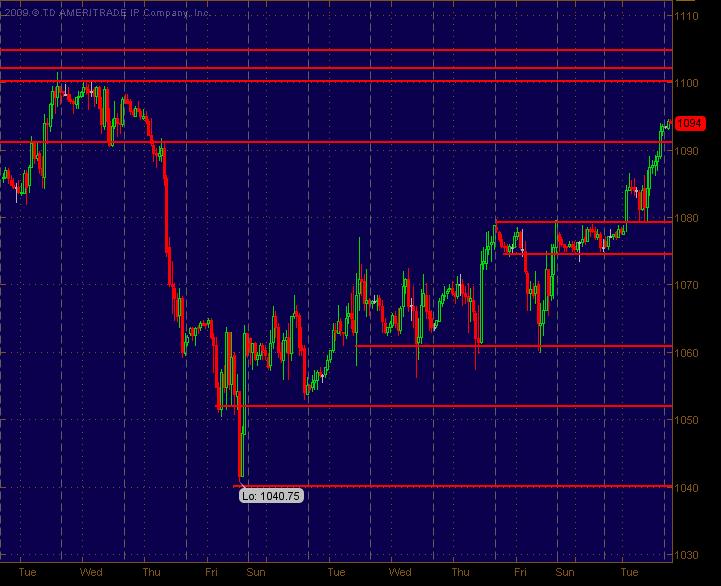
I've updated the hourly ES chart this eve with S/R price action levels that I see fwiw. the 1100-1102 zone looks pretty significant to me ... but 1105 also is a potential resistance area with the way I see things. I don't like a 5-POINT zone for trying to trade off of. But that's what I've got for now ... makes an upside fade trade more difficult imho.
Anyway, here's the updated chart ... hoping it's helpful and makes a tad bit of sense from an S/R perspective.
Click image for original size
Hey RiskyB,
Appreciated your post. If you can, it'd be cool to see a chart from ya where you see S/R levels ... and even which ones are weighted heavier than others. Dive in! And any and all input, analysis and aditional S/R related postings are not only welcome but highly encouraged from folks!
Appreciated your post. If you can, it'd be cool to see a chart from ya where you see S/R levels ... and even which ones are weighted heavier than others. Dive in! And any and all input, analysis and aditional S/R related postings are not only welcome but highly encouraged from folks!
S/R price levels on an Hourly chart for Monday ... just my take on price action.
Click image for original size
Monkey's take, is a very, very, very fine take
With two trades today in the bank
Little chance now my account will tank
Now everything is easy
'Cause of the Monkey...
My very sincere apologies to Crosby, Stills, Nash & Young for that satirical massacre :-)
With two trades today in the bank
Little chance now my account will tank
Now everything is easy
'Cause of the Monkey...
My very sincere apologies to Crosby, Stills, Nash & Young for that satirical massacre :-)
Massacre? No way man ... I busted out the git-fiddle, pickin' and a grinin' my way through your lyrics for hours.
And I couldn't help but think of some other simian friends belting out something about a "day trade believer" ... hey, hey, we're all Monkees:
You once thought of me
As a trader watching CNBC.
Now you know how happy I can be.
Oh, and our good times start and end
Without dollar one to spend,
But how much, baby, do we really need?
(And they weren't even a real group ... as colorfully noted by Sam Kinison)
MonkeeMeat
ps. Woooooooooot!
Posting the same ES 1-hour chart with S/R levels still intact and active from my "read" of the market. Thought I'd also circle the area where price found resistance within a tick or two of a level above the market that I posted this weekend for coming into today's trading day fwiw. Happy monkey flips to all and hope these postings are at least semi-helpful. And, as always, am open to any feedback and/or additional analysis and chart postings!!!
Click image for original size
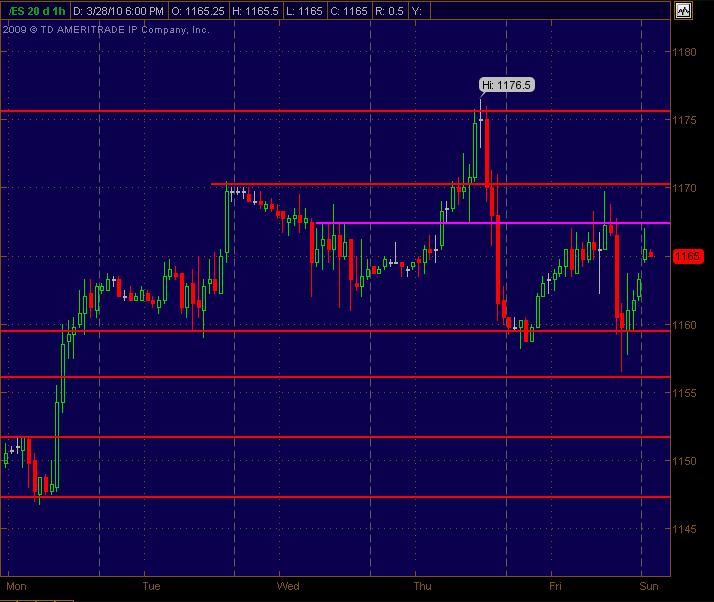
Here's the same 1-hour chart without any updates on the S/R lines ... simply pointing out where/how price reacts off of or pushes up against and then punches through for a run. The magenta line is one I drew in from the daily chart. As usual, always want any and all feedback or additional ideas on price action. I need to now update this chart's S/R lines from looking at multiple time frames. But this still, to this day after trading and tracking S/R for over a decade, surprises me as to the xtra edge it lays out in advance fwiw.
Click image for original size
MM, Thanks for posting the chart.
Monday's S1 is 1125.75, Weekly pivot for this coming week is 1126.5, which happens to correspond to one of those red lines drawn in your chart.
Should be an important level to watch next week.
Monday's S1 is 1125.75, Weekly pivot for this coming week is 1126.5, which happens to correspond to one of those red lines drawn in your chart.
Should be an important level to watch next week.
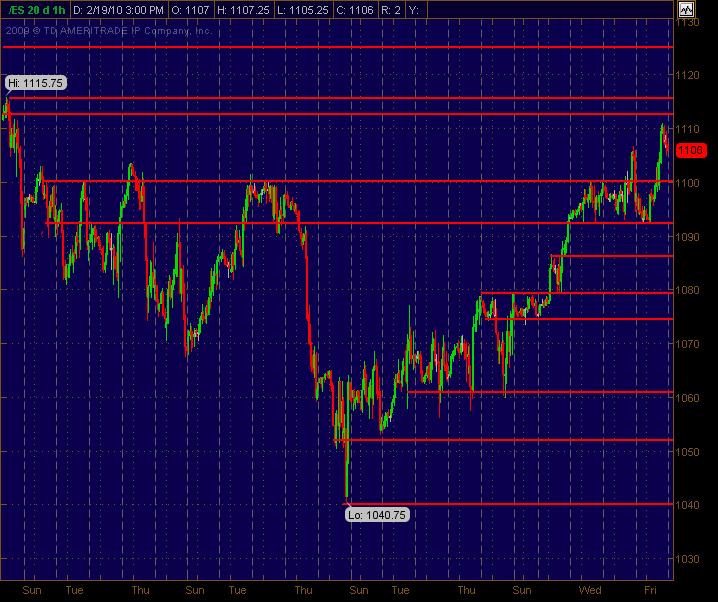
Here's an update of Price Action S/R levels for the ES coming into Monday 3-29-10. I looked at a bunch of daily equity charts and really wasn't turned on for many longs (or shorts) ... mixed. That's what I've seen the past few days fwiw. And the SP has been "sloppy" trading back and forth intraday for the past few sessions. (even though there have been some decent moves for trades).
Anyway, it still looks choppy (at least to me) now after such a strong and grinding run up the past few weeks ... even on low volatility. Hope this helps as a roadmap with some ideas. As always, open to any and all analysis and feedback.
Anyway, it still looks choppy (at least to me) now after such a strong and grinding run up the past few weeks ... even on low volatility. Hope this helps as a roadmap with some ideas. As always, open to any and all analysis and feedback.
Click image for original size
Emini Day Trading /
Daily Notes /
Forecast /
Economic Events /
Search /
Terms and Conditions /
Disclaimer /
Books /
Online Books /
Site Map /
Contact /
Privacy Policy /
Links /
About /
Day Trading Forum /
Investment Calculators /
Pivot Point Calculator /
Market Profile Generator /
Fibonacci Calculator /
Mailing List /
Advertise Here /
Articles /
Financial Terms /
Brokers /
Software /
Holidays /
Stock Split Calendar /
Mortgage Calculator /
Donate
Copyright © 2004-2023, MyPivots. All rights reserved.
Copyright © 2004-2023, MyPivots. All rights reserved.