The trading Matrix
This quick thread is based around the ideas of Dr. Brett. I want to see if they hold up over time and the affect the overnight session has on the day session in the ES. Any and all ideas are welcome.
Basic premise I'm working with for today is this.
1)If the overnight high is contained within yesterdays day session and that high acts as support then we will go on to test the R1 level and the previous days high.
2)If the overnight high fails we will test the overnight midpoint and the S1 level and the previous days lows...
3)If the overnight low holds we will test the Overnight midpoint and the r1
Yesterday in the ES we have a high of 1176.50 a low of 1160.25 and a settlement of 1162.75. So the standard pivots are as follows:
R1 = 72.75
pv = 66.50
s1 = 56.50
The current overnight high is 1168.25 and the low is 1158.25.
We also need to incorporate the following statistics that Dr. Brett uses these being the Pivot being hit 75% of the time and R1 or S1 hitting 70%. He also uses an 85% probability of the previous days RTH high or low being broken. Some damn good stats if they are true.
On charts and in text I'll be using the following:
ONH = Overnight High
ONL = Overnight Low
ONM = Overnight midpoint
PDL = previous days low
PDH = previous days high
EDIT********************************
The overnight session can only do a few things that we can base our daily matrix around and that is:
Make a HH and HL then the RTH
Make a LL and LH then RTH
Make an outside bar to RTH
Make an inside bar to RTH
No differnt then comparing RTH to RTH really
***************************************************
I'd prefer to keep this to concepts and not specific trades. I have a nasty habbit of mixing trades in posts and also mixing trade concepts. So please feel free to slap me around if I get out of context for this thread. Of course post whatever you think that helps in understanding the matrix as I am not the best communicator in posts.
Bruce
the relationship between AH and RTH has always been of interest to me, unfortunately I have not been able to come up with hard and fast list of rules.
I will search the net for Steenbarger articles and I will review notes I have made to see what might be useful in this thread
I will search the net for Steenbarger articles and I will review notes I have made to see what might be useful in this thread
Originally posted by BruceM
This quick thread is based around the ideas of Dr. Brett. I want to see if they hold up over time and the affect the overnight session has on the day session in the ES. Any and all ideas are welcome.
Basic premise I'm working with for today is this.
1)If the overnight high is contained within yesterdays day session and that high acts as support then we will go on to test the R1 level and the previous days high.
2)If the overnight high fails we will test the overnight midpoint and the S1 level and the previous days lows...
3)If the overnight low holds we will test the Overnight midpoint and the r1
Yesterday in the ES we have a high of 1176.50 a low of 1160.25 and a settlement of 1162.75. So the standard pivots are as follows:
R1 = 72.75
p = 66.50
s1 = 56.50
The current overnight high is 1168.25 and the low is 1158.25.
I'll edit and type more later
Are the rules valid on first touch only, or multiple times throughout the day session?
And what about overnight bias, will that play a factor?
Hi Phileo,
I've never been able to qualify how many times is a fair amount of times to determine a successful test of an area. For me I like to see how much time and full one minute bars are trading below or above a zone. You may be referring to areas that are tested later on in the day. Help clarify your question please?
I'm a very descretionary trader so I donot use specific set rules. I will tell you that many times the stronger money will try to push 2 - 5 points beyond an area to shake folks out and then frustrate them by moving it in the desired direction. Perhaps over time we'll be able to come up with specific rules or if you have any then please feel free to share them.
Bruce
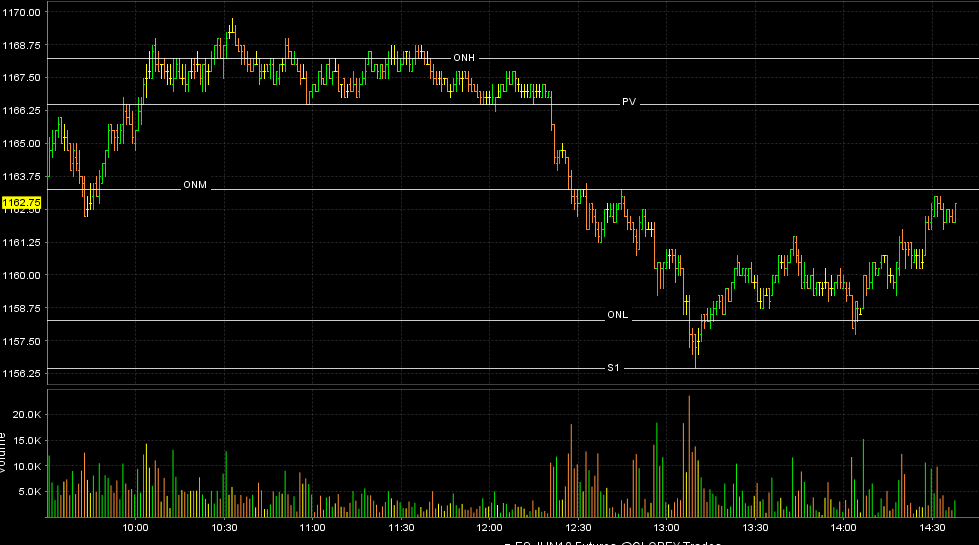
This morning saw a test into the ONH and the PV after testing the ONM. I only counted 5 one minute bars that stayed completely above the ONH. The theory stats that if we can not stay above the overnight high then we should go on to test the ONM and then we need to start thinking about the other probabilities in this case the PDL , the ONL and the S1.
I'm realizing as I type this that the order and further targets will change. Some days we may hit an S1 before a PDL etc so we need to account and write down a matrix for each trading day.
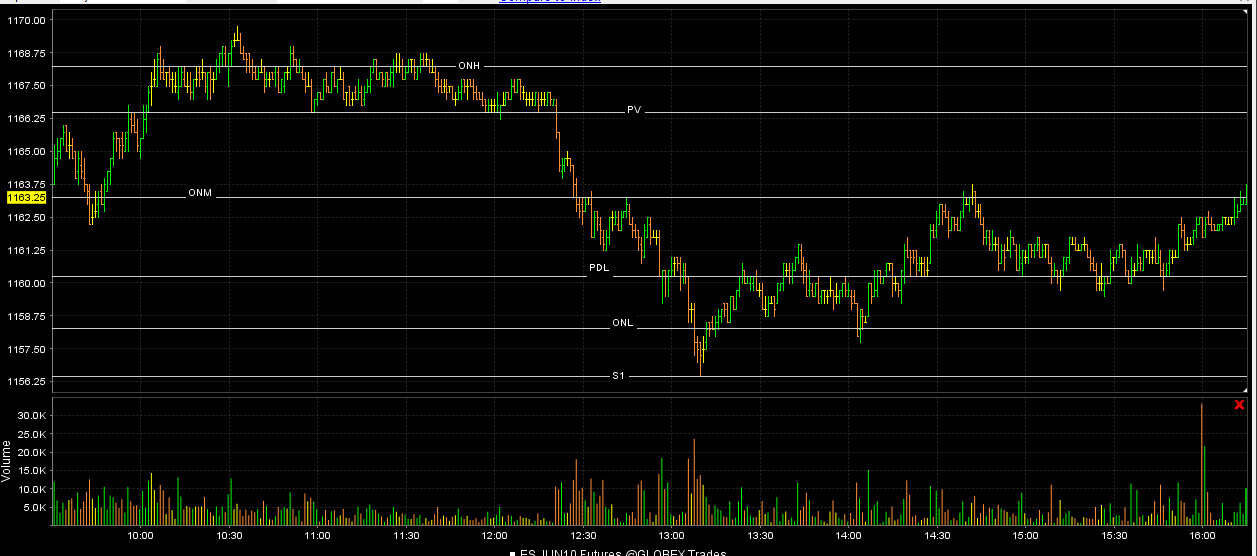
OK, so today we failied at the ONH and then broke through the PV, the ONM, the PDL, the ONL and the S1.
Then we popped up again above the ONL , retested it and rallied to the ONM from below. So today we had two trades where they couldn't hold the overnight range and brought it back to the midpoint.
If anyone wants to chime in and make all these thoughts more user friendly then please do. I won't be insulted in any way. I'm seeking clarity of the ideas. Sometimes this is why I post so much. It really helps me too. Here is the chart up until about 2:30...I'll update this when the day ends.
Bruce
I'm realizing as I type this that the order and further targets will change. Some days we may hit an S1 before a PDL etc so we need to account and write down a matrix for each trading day.
OK, so today we failied at the ONH and then broke through the PV, the ONM, the PDL, the ONL and the S1.
Then we popped up again above the ONL , retested it and rallied to the ONM from below. So today we had two trades where they couldn't hold the overnight range and brought it back to the midpoint.
If anyone wants to chime in and make all these thoughts more user friendly then please do. I won't be insulted in any way. I'm seeking clarity of the ideas. Sometimes this is why I post so much. It really helps me too. Here is the chart up until about 2:30...I'll update this when the day ends.
Bruce
Click image for original size
here s how Friday ended...right at the overnight midpoint (ONM)
Click image for original size
any help on this would be appreciated
Originally posted by PAUL9
the relationship between AH and RTH has always been of interest to me, unfortunately I have not been able to come up with hard and fast list of rules.
I will search the net for Steenbarger articles and I will review notes I have made to see what might be useful in this thread
I have meaurements that might be useful, although I have not quantified (historical backtest).
How do I create a thread? Or, I can just do it right here, although I have not applied these particular measurements to AH PA.
WHere did you get Steenbarger study of AH, is there a url?
How do I create a thread? Or, I can just do it right here, although I have not applied these particular measurements to AH PA.
WHere did you get Steenbarger study of AH, is there a url?
Originally posted by PAUL9
How do I create a thread?
A thread on this forum is called a topic. You'll see a New Topic link at the top of this page.
The studies I'm using are just a consolidation of some ideas he has posted over time...I'm not sure they are in one place on his site...he basically thinks that the overnight should be looked at as a seperate trading day and we'll hopefully see here if we can come up with some useful plan from that concept.
Not sure if you need the blog site but here it is...lots of stuff there
HTTP://traderfeed.blogspot.com
Not sure if you need the blog site but here it is...lots of stuff there
HTTP://traderfeed.blogspot.com
Originally posted by PAUL9
WHere did you get Steenbarger study of AH, is there a url?
The market has made a HH and HL in the overnight. The matrix says:
1) that if we can overtake the overnight high ( EDIT: and hold above it)then we should target R2 which is 76 today.
If we fail at these highs then the Midpoint at the 67 area and the Pivot of 63 and overnight low at 64 is the target.
The matrix says:
2) if we take out the overnight low at 64 (EDIT: and hold below them)then we can target Fridays lows at 56.50 with the S1 level being at 56.75 today.
If we hold the overnight lows than we can target the midpoint at 67 and then the overnight high at 71 is the next target with yesterdays highs at 69.75 and R1 at 70.
Lots of numbers in the 70 - 71 area today.
We are set to open near the overnighgt midpoint at 67.50 so the agressive trader will trade to target the overnight high or low. Most would do well to wait to see what happens at the extremes of the overnight range.
The ONH is 71 and the low is 64 ..
Monday was a unique (and for me, untested) situation due to the abbreviated Friday session, but that session was technically ALL AH action). All I did was apply the 50% of the previous day measure.
Monday's PA after 11:00am is one thing that continues to compel me to figure out a "methode de trade" that is only during the 6am to 11 am window (unless there are specific conditions in place; exactly what those conditions are, I do not know yet.)
Monday's PA after 11:00am is one thing that continues to compel me to figure out a "methode de trade" that is only during the 6am to 11 am window (unless there are specific conditions in place; exactly what those conditions are, I do not know yet.)
Emini Day Trading /
Daily Notes /
Forecast /
Economic Events /
Search /
Terms and Conditions /
Disclaimer /
Books /
Online Books /
Site Map /
Contact /
Privacy Policy /
Links /
About /
Day Trading Forum /
Investment Calculators /
Pivot Point Calculator /
Market Profile Generator /
Fibonacci Calculator /
Mailing List /
Advertise Here /
Articles /
Financial Terms /
Brokers /
Software /
Holidays /
Stock Split Calendar /
Mortgage Calculator /
Donate
Copyright © 2004-2023, MyPivots. All rights reserved.
Copyright © 2004-2023, MyPivots. All rights reserved.