The trading Matrix
This quick thread is based around the ideas of Dr. Brett. I want to see if they hold up over time and the affect the overnight session has on the day session in the ES. Any and all ideas are welcome.
Basic premise I'm working with for today is this.
1)If the overnight high is contained within yesterdays day session and that high acts as support then we will go on to test the R1 level and the previous days high.
2)If the overnight high fails we will test the overnight midpoint and the S1 level and the previous days lows...
3)If the overnight low holds we will test the Overnight midpoint and the r1
Yesterday in the ES we have a high of 1176.50 a low of 1160.25 and a settlement of 1162.75. So the standard pivots are as follows:
R1 = 72.75
pv = 66.50
s1 = 56.50
The current overnight high is 1168.25 and the low is 1158.25.
We also need to incorporate the following statistics that Dr. Brett uses these being the Pivot being hit 75% of the time and R1 or S1 hitting 70%. He also uses an 85% probability of the previous days RTH high or low being broken. Some damn good stats if they are true.
On charts and in text I'll be using the following:
ONH = Overnight High
ONL = Overnight Low
ONM = Overnight midpoint
PDL = previous days low
PDH = previous days high
EDIT********************************
The overnight session can only do a few things that we can base our daily matrix around and that is:
Make a HH and HL then the RTH
Make a LL and LH then RTH
Make an outside bar to RTH
Make an inside bar to RTH
No differnt then comparing RTH to RTH really
***************************************************
I'd prefer to keep this to concepts and not specific trades. I have a nasty habbit of mixing trades in posts and also mixing trade concepts. So please feel free to slap me around if I get out of context for this thread. Of course post whatever you think that helps in understanding the matrix as I am not the best communicator in posts.
Bruce
Originally posted by BruceM
I'm not sure if this is cool to post this but it's a post that will remain on Dr. Bretts site for only a limited time. Let me know DT if I need to delete this..
[Removed by Admin]
I went on to his blog and hunted around and found something that intimated that he did not want his posts republished so I deleted it from your post.
As I have already stated, AH PA has always been of interest to me and there is something evident in the last few trade days that is incredibly consistent.
I read Steenbarger but missed his "only posted for a short-time" post. Is there a possibility that something like that can be done here? Me willing to share a technical measure, but only for a couple of hours?
I read Steenbarger but missed his "only posted for a short-time" post. Is there a possibility that something like that can be done here? Me willing to share a technical measure, but only for a couple of hours?
we can delete a post after a certain point if you wish Paul..you could tell us how long you want it posted for and then me or one of the other moderators would delete it...
I hope that's what you meant by your post...
The steenbarger post is still there if you wish to view it on his site
I hope that's what you meant by your post...
The steenbarger post is still there if you wish to view it on his site
maybe I'm being ridiculous, but a lightbulb clicked on early this morning as I was ever-reviewing AH charts. (I have been studying AH charts for about 6 months, unable to come up with anything much more than just a couple of minor observations (which I was going to post with the hope that someone else might see something that takes it to the next level),
I feel obliged to share because I do appreciate your AIR obs (and this appears to tie in with AIR but it is based on the AH).
I will do a little more research (Me looking at charts) and see whether there is consistency. WHat I have seen might only be the product of a tight range market, or maybe more importantly, a non-trending market.
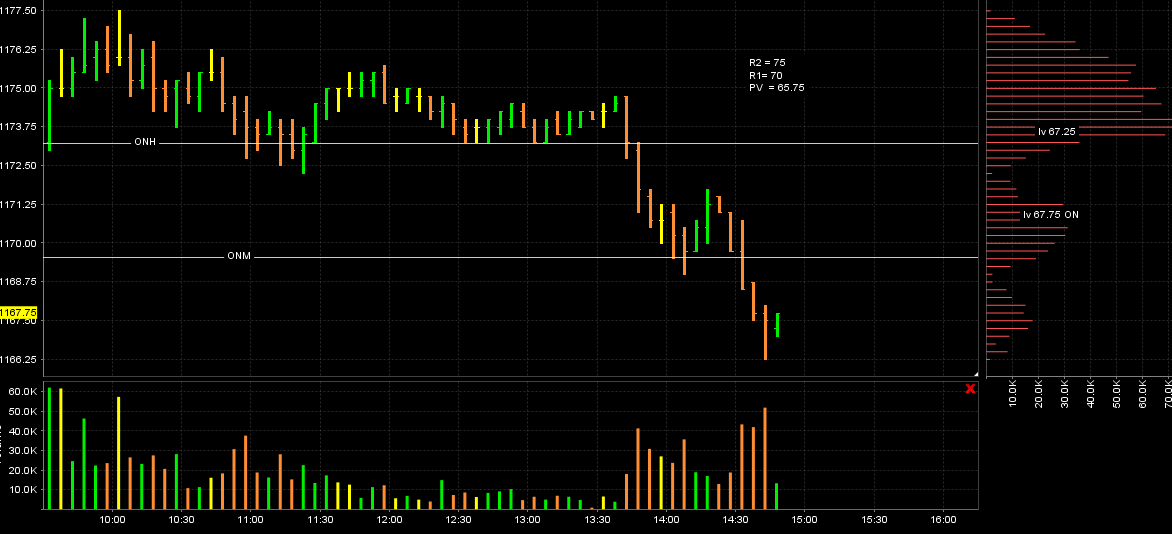
I was kinda hoping today would be a gap and go for the sake of having a good example but we need to take what we see. We opened right at the ONH and went up a bit beyond the R2 level but for this thread we are really looking at what happend at the ONH or low. They tried to support the market and the 11 - 11:20 tests of that overnight high had only had one, one minute bar below the ONH.
It just wasn't enough and they sold it off to go get the ONM once again this week. You could see the battle if you look at the NQ and when it was below it's ONH. Here is part of the ES chart.
It just wasn't enough and they sold it off to go get the ONM once again this week. You could see the battle if you look at the NQ and when it was below it's ONH. Here is part of the ES chart.
Click image for original size
Dr. B has a bonus post posted for those interested....another one.....it must be his Easter/passover gift....it won't stay up too long....Hope all enjoy the weekend...
Originally posted by BruceM
Dr. B has a bonus post posted for those interested....another one.....it must be his Easter/passover gift....it won't stay up too long....Hope all enjoy the weekend...
I've never noticed him taking down any of his posts and I can see that the archives go back to December 2005... Have you found that his posts are removed sometimes?
I haven't noticed that happening DT but I don't get there as often as I should. He specifically mentions taking them down so I believe he will.
Originally posted by day trading
Originally posted by BruceM
Dr. B has a bonus post posted for those interested....another one.....it must be his Easter/passover gift....it won't stay up too long....Hope all enjoy the weekend...
I've never noticed him taking down any of his posts and I can see that the archives go back to December 2005... Have you found that his posts are removed sometimes?
Originally posted by BruceM
I haven't noticed that happening DT but I don't get there as often as I should. He specifically mentions taking them down so I believe he will.Originally posted by day trading
Originally posted by BruceM
Dr. B has a bonus post posted for those interested....another one.....it must be his Easter/passover gift....it won't stay up too long....Hope all enjoy the weekend...
I've never noticed him taking down any of his posts and I can see that the archives go back to December 2005... Have you found that his posts are removed sometimes?
If he says that he'll remove them then there's no reason to believe that he won't. I know that he writes a lot of books so the content on the blog is probably what goes into the books and so to sell the book he probably takes it down otherwise there would be no point in buying the book if you can get it for free on his blog.
The other meta-discussion we were having on here has been moved to here:
http://www.mypivots.com/Board/Topic/5571/-1/meta-negativity-and-voting
I don't know how long I want to keep this up (because this really does look like an edge to me (if you scalp). It's worth more study, I'm sharing it so some other traders can look at it and discover other idiosyncrasies for profit (and share them)
I've been looking at AH charts for months and months, but it wasn't until this past week that "a" lightbulb lit and this is something that deserves additional study.
Light bulb clicked on as I was reading a Steenbarger comment regarding overnight Highs and Lows, he said that 90% of the time, the overnight H or L is taken out in the RTH. (O/N = overnight, same as AH = After Hours) 90% is a huge number, but when you consider that the 90% refers to taking out either the AH High -OR- the AH Low, big deal.
Get a load of this.
Whether RTH Price FIRST takes out the AH High or the AH Low might simply be a function of Price Action in today's AH versus PA in the Previous Day (PD) AH.
Working Hypothesis: if AH PA (Price Action) finds support at or above the 50% retracement level of the previous Day's AH action, then the first trip for price in RTH is to take out of AH High.
If AH finds resistance at or below previous AH 50% retracement, then aim at First taking out AH Low in RTH.
Believe me, there are many other market structure price levels that can complicate this (previous week's H, previous week's L, H or L from 2 days ago, etc.--Also, even the pattern displayed in the AH, like a DB or a DT or a tight sideways channel or a directional drift, etc.
I have been fooling around with:
* maybe End of previous AH VWAP is better to use,
* should the 30minute bars be interpreted using BruceM's "AIR" observations.
* Where is price relative to previous week's H?
* Is day of week or even post holiday (like today) a special case?
* Is push to upside that is a "first test" of previous week's H or L a factor in interpretation (first tests of new price territory usually fail, which is one of the premises employed in BruceM's "Air" obs.(more on that later)
but PA relative to the previous day's AH range is the starting point for this hypothesis.
Anyway, here is a chart of last week
Upper chart is AH only.
Bottom chart is 24hour pricing,
In the bottom Chart, the vertical
Blue histograms are identifying the last 30 minute bar of the overnight action.
IN Upper chart, Little cyan rectangles identify AH session, M-T means end of Monday RTH to beginning of Tuesday RTH.
Wide red ellipses encompass Blue horizontal arrows, these are the 50% retracement levels of the previous day's AH PA.
Look and See:
1) AH PA finds support at or above 50% of PD AH, most of time Px takes out AH H first.
2) AH PA finds resistance at or below 50% of PD AH, RTH targets take out of AH L.
Monday was a unique (and for me, untested) situation due to the abbreviated Friday session, but that session was technically ALL AH action). All I did was apply the 50% of the previous day measure.
Monday's PA after 11:00am is one thing that continues to compel me to figure out a "methode de trade" that is only during the 6am to 11 am window (unless there are specific conditions in place; exactly what those conditions are, I do not know yet.)
Monday's PA after 11:00am is one thing that continues to compel me to figure out a "methode de trade" that is only during the 6am to 11 am window (unless there are specific conditions in place; exactly what those conditions are, I do not know yet.)
Emini Day Trading /
Daily Notes /
Forecast /
Economic Events /
Search /
Terms and Conditions /
Disclaimer /
Books /
Online Books /
Site Map /
Contact /
Privacy Policy /
Links /
About /
Day Trading Forum /
Investment Calculators /
Pivot Point Calculator /
Market Profile Generator /
Fibonacci Calculator /
Mailing List /
Advertise Here /
Articles /
Financial Terms /
Brokers /
Software /
Holidays /
Stock Split Calendar /
Mortgage Calculator /
Donate
Copyright © 2004-2023, MyPivots. All rights reserved.
Copyright © 2004-2023, MyPivots. All rights reserved.