Chart Game: Real vs. Random
Ran across an interesting link on Steenbarger's Traderfeed blog.
http://web.mit.edu/alo/www/Papers/arora.html
Can you tell the difference between a randomly generated chart and a real one? Research has been conducted to find out if subjects could distinguish between random vs. real. Find out the results and play the "online game" yourself if ya like. The registration is quick and they don't ask for a bunch of personal info.
If anything it's entertaining ... a little bit of fun ... and perhaps a learning tool/experience in some way or another.
To quote from that page:
Emphasis at the end is mine. I don't think that that part is true. The experiment demonstrates that humans can tell the difference between a random set of data and an actual market price series. However, just because that is true does not mean that a computer cannot do the same.
Remember that a human brain can learn to distinguish the difference between types of data even though it cannot explain how or why it can do that differentiation. A computer can also "learn" or be taught the same rules that the unconscious human brain is applying.
Thanks for starting this topic MM. This type of work is probably some of the most important for traders to understand in the years to come.
We construct a financial "Turing test" to determine whether human subjects can differentiate between actual vs. randomized financial returns. The experiment consists of an online videogame where players are challenged to distinguish actual financial market returns from random temporal permutations of those returns. We find overwhelming statistical evidence (p-values no greater than 0.5%) that subjects can consistently distinguish between the two types of time series, thereby refuting the widespread belief that financial markets "look random". A key feature of the experiment is that subjects are given immediate feedback regarding the validity of their choices, allowing them to learn and adapt. We suggest that such novel interfaces can harness human capabilities to process and extract information from financial data in ways that computers cannot.
Emphasis at the end is mine. I don't think that that part is true. The experiment demonstrates that humans can tell the difference between a random set of data and an actual market price series. However, just because that is true does not mean that a computer cannot do the same.
Remember that a human brain can learn to distinguish the difference between types of data even though it cannot explain how or why it can do that differentiation. A computer can also "learn" or be taught the same rules that the unconscious human brain is applying.
Thanks for starting this topic MM. This type of work is probably some of the most important for traders to understand in the years to come.
I'm going to throw my two cents out there on this. When I heard about how random charts supposedly look just like 'real' charts I was very skeptical. I read a very prominent book showing this. I was easily able to tell random from 'real' charts, I felt. I created random charts myself, and found things in them that you simply don't see in 'real' charts. One of my 'specialties' (as I'm sure it is for many others in here, too) is reading price action. It wasn't a big challenge to see the subtle differences.
So, when I followed up this link I was confident I would be able to tell the difference quite easily. The first thing I noticed was I didn't think the charts would not only be dynamic, but very fast moving. I mean, when do you see charts moving this fast in real life? Even when I follow 13-tick chart in the ES they're slow as molasses compared to those charts. I want to study the two charts and make my assessments.
Nonetheless, I had to go with what they gave us. I was able to adapt pretty quickly to the fast movement. I am just looking for certain 'price signatures' that simply don't happen in 'real' price action. I found that after a very short period of adjustment I was able to make it through an entire series and find the 'real' price action without a single miss.
I wasn't looking for anything that said 'real', I was always looking for a signature that said 'not real'. I also found that I work mostly with bar charts, and I have little feel for line charts. This alone took away a lot of my experience. I think I could do this a lot easier with bar charts. Add in time to think, and I think I could do this with extreme ease. That's just my opinion.
Another thing I want to point out here is the concept that those who have a point to prove can 'affect' the potential results by setting up an experiment a certain way. They can choose a 'real' price chart, and then do literally trillions of random charts, and have the computer do a matching algorithm to find close-looking ones. I suspect some of that was done here, since the charts followed similar paths.
Now, the idea is to just compare 'real' with random, yet the choice for the random chart is not random at all, but carefully selected. Makes me wonder what may happen if the 'real' charts are very carefully selected. Or if I revealed the characteristics I look for (I am not willing to reveal them because I don't want researchers to run quadrillions of random charts and have a computer algo search for the handful that don't have this characteristic, to 'prove' their point) and that was factored in.
The one thing I noticed from that one book I read was that if you take a real chart, and you come up with some computer model, and run almost infinite iterations you can surely come very close to generating that chart. I feel that demonstrates essentially nothing about the nature of the market or price action. One hasn't 'figured out' price action, or really shown anything else with that.
Anyway, I was very happy after playing with that simulation, because I was able to pick out 'real' price action basically with ease. This is no claim, just one man's opinion, but the more work I do with my methodology the more order I see, and the less random I view price action. I know we are all very primative in our knowledge of market action compared to 'total knowledge', but the more I learn the more amazed I become. This simulation really increased my confidence in my work, because I felt I 'should' have been able to pick out 'real' action with ease, and I was able to in this trial. Again, no claims, just my own unique experience and opinion.
Click image for original size
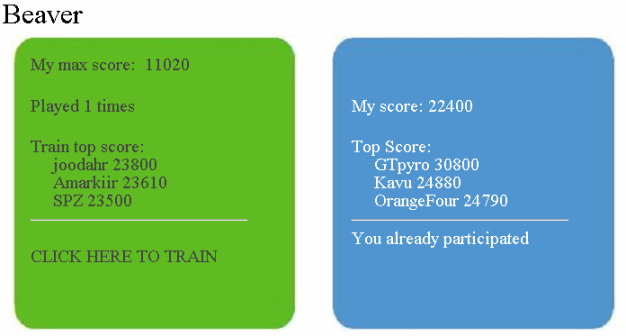
I'm guessing that any of us with any long-term experience in the market are going to be able to pick out the 'real' data with ease. I can't wait to see how this shakes out. So much for those random-walkers, once again.
The more time I've spent with this exercise, the more it tweaks with my head. In a way, it's peeled back the veneer of a few things about how I read charts ... things to revisit and refine. I scored semi-decently, but not what I thought I would, could or should be scoring.
Btw, good comments Jim and Daytradingmeister! And Jim, have you ever written a post less than 10,000 words in length? Actually, your comprehensive thought process(es), combined with your communication ability generated in your typed/written words, is something I find of great value on all posts fwiw. Not just blowing smoke up your @ss ... just sharing an appreciation for thought provoking content and learning. Always good stuff for all here!
Btw, good comments Jim and Daytradingmeister! And Jim, have you ever written a post less than 10,000 words in length? Actually, your comprehensive thought process(es), combined with your communication ability generated in your typed/written words, is something I find of great value on all posts fwiw. Not just blowing smoke up your @ss ... just sharing an appreciation for thought provoking content and learning. Always good stuff for all here!
Jim's trading room
Click image for original size
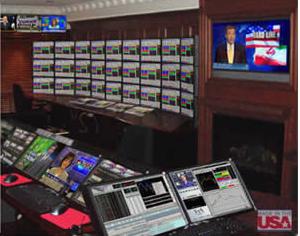
Hey, Monkey, funny posts there. Yeah, if you think I'm wordy in the written form, you should try talking to me for awhile. That makes my written form of communication look like I'm in favor of the one word answer. I can go 5-6 hours without a break easy. I once went on a road trip with a buddy and we went about 18 hours of talking without stopping. I was hoarse for three days after that. My better half, she really doesn't appreciate my 'wordy' quality, being more the non-talkative type. Don't even ask how we hooked up... And yes, given my tendency to overdo things, my trading room does look a bit like that. I'm glad you get something out of my posts.
Hi Jim,
Well, I like more thoughtful and thorough responses - so from me kudos for taking the time to share. The move to sound bites is the bane of the net.
Don't shorten the responses as far as I'm concerned.
Well, I like more thoughtful and thorough responses - so from me kudos for taking the time to share. The move to sound bites is the bane of the net.
Don't shorten the responses as far as I'm concerned.
Okay, the master of beating the dead horse will keep his beating stick handy
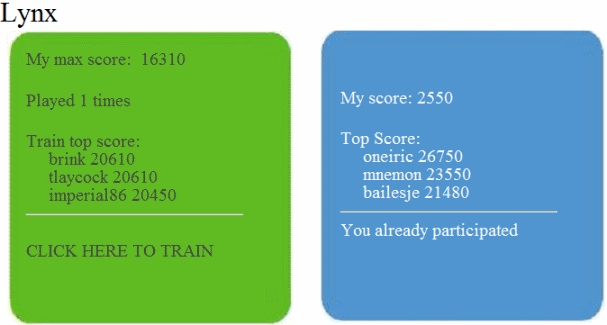
Strange that for the training on the Lynx test I felt like I "got it" and knew what the difference between the real and random series were. However, when I did the actual test I couldn't have sucked worse. At one point my score was -450.
Click image for original size
Originally posted by MonkeyMeat
...Then I noticed something ... not about the way the chart was "unfolding" but about the chart line of its supposed price history. The wrong ones had a little more of a consistently jagged look, as if it was generated with a 5-year old using an old Etch-a-Sketch.
So, it wasn't so much about recognizing an actual price chart (at least in this particular example), it was about recognizing what was NOT a real price chart. Then it was easy and I simply didn't click on the one that looked like an Etch-a-Sketch...
From my post on 3/27:
"...I am just looking for certain 'price signatures' that simply don't happen in 'real' price action. I found that after a very short period of adjustment I was able to make it through an entire series and find the 'real' price action without a single miss. I wasn't looking for anything that said 'real', I was always looking for a signature that said 'not real'..."
So, you discovered what I did, a 'look' to price action that simply doesn't exist in real price action. The problem is, I'm sure the random walker researchers can now take this and apply various functions on random data to remove what we are seeing. Given enough manipulation I'm sure real action could be mimicked or modeled. But then I'm sure I can find other subtleties, and then if I reveal them, they can manipulate the data more to hide those. Probably at some point I may not be able to 'beat' the computer as it tries to disguise the differences.
No matter what they do, though, it can never 'make' the market random if it's not just because a random model can be manipulated with great effort to finally look like something real. I mean, would a mountain range be declared not to exist in the real world if a fractal generator did 10^25 iterations and then finally couldn't be told from a picture of the real mountain?
I found that all the trials had differences I was able to detect, and I was able to do basically the same thing on all series. You just need to see what those 'unreal' price action signatures are for each series.
Emini Day Trading /
Daily Notes /
Forecast /
Economic Events /
Search /
Terms and Conditions /
Disclaimer /
Books /
Online Books /
Site Map /
Contact /
Privacy Policy /
Links /
About /
Day Trading Forum /
Investment Calculators /
Pivot Point Calculator /
Market Profile Generator /
Fibonacci Calculator /
Mailing List /
Advertise Here /
Articles /
Financial Terms /
Brokers /
Software /
Holidays /
Stock Split Calendar /
Mortgage Calculator /
Donate
Copyright © 2004-2023, MyPivots. All rights reserved.
Copyright © 2004-2023, MyPivots. All rights reserved.