Streaming Stock Scanner as Mkt. Indicator
I tend to trade mostly stocks (day and short, short term) but track the primary equity index futures - especially the ES. I draw in Price Action lines of potential S/R levels and follow it as a map for entering, exiting and magaging stock trades.
I'll also trade options and the futures outright ... but am more focused on hunting down equity trades. The reason for the preface here is that a few years ago I noticed something kinda cool with the real time stock scanning software that I use. I've been using Trade Ideas for years and am used to it, but there are other similar programs available.
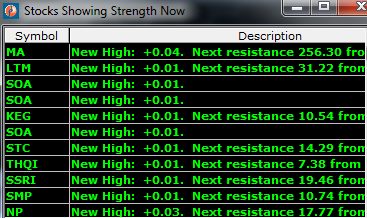
Anyway, one of the several screens I've always run was for stocks making new session highs and stocks making new session lows. I had a seperate small window for each one with the stock symbols that scroll by for new highs in green and the new session lows in red.
Here's a snapshot example of what it might look like:
The speed with which stocks scroll by for both new session highs vs. lows can be very telling. It's an internal view of what's taking place on the ES. In fact, I think you can load in (or choose) to track only the SP-500 stocks. And instead of new session highs/lows, one could find some other similar parameters to track. In a way, this functions like tracking the TICK or TRIN etc. except it's different in how "real time" it is along with other nuances that can be discerned over time for how the ES trades/moves.
It can help confirm a move or, for example, if the ES starts an upmove yet the new highs haven't really sped up much and the new lows may have slowed but not by much, then that ES upmove could be considered suspect. I believe this analysis may be geared more for the scalper or short term intraday index trader.
Just thought I'd toss this out there since it has helped me get a better sense of market moves and what may be strong vs. weak scalp moves. And one could also load in sectors and track them in another window ... or add (or split up) stocks into different windows that are weighted more heavily in the SP-500 etc. I'm sure there are many ways that could be found to make this more effective as another tool that could help with ES trading.
And the cool thing is you don't have to be a programming genius to monkey around with the scans/screens. Seriously, I use TradeStation for charting some but couldn't code in "Easy Language" if you put a gun to my head. I've used Trade Ideas, so that's what I'm familiar with. There's also MadScan out there which I think is very similar, but I'm not sure since I've not used it myself.
I don't know if this is something "fresh" or if there are other folks already using a product in this way. And I'm referring to a real time screen that "streams" stock symbols through a window.
These type of scanning services typically offer a first month free (or cheap) trial. Worst case scenario, you can buy a month and see if it's useful and how (or not). Then share your results here good or bad. Open to any questions, feedback or additional ideas related to the topic!
Here's a couple of links (I'm sure there are other good ones out there as well):
www.trade-ideas.com
www.madscan.com
I'll also trade options and the futures outright ... but am more focused on hunting down equity trades. The reason for the preface here is that a few years ago I noticed something kinda cool with the real time stock scanning software that I use. I've been using Trade Ideas for years and am used to it, but there are other similar programs available.
Anyway, one of the several screens I've always run was for stocks making new session highs and stocks making new session lows. I had a seperate small window for each one with the stock symbols that scroll by for new highs in green and the new session lows in red.
Here's a snapshot example of what it might look like:
Click image for original size
The speed with which stocks scroll by for both new session highs vs. lows can be very telling. It's an internal view of what's taking place on the ES. In fact, I think you can load in (or choose) to track only the SP-500 stocks. And instead of new session highs/lows, one could find some other similar parameters to track. In a way, this functions like tracking the TICK or TRIN etc. except it's different in how "real time" it is along with other nuances that can be discerned over time for how the ES trades/moves.
It can help confirm a move or, for example, if the ES starts an upmove yet the new highs haven't really sped up much and the new lows may have slowed but not by much, then that ES upmove could be considered suspect. I believe this analysis may be geared more for the scalper or short term intraday index trader.
Just thought I'd toss this out there since it has helped me get a better sense of market moves and what may be strong vs. weak scalp moves. And one could also load in sectors and track them in another window ... or add (or split up) stocks into different windows that are weighted more heavily in the SP-500 etc. I'm sure there are many ways that could be found to make this more effective as another tool that could help with ES trading.
And the cool thing is you don't have to be a programming genius to monkey around with the scans/screens. Seriously, I use TradeStation for charting some but couldn't code in "Easy Language" if you put a gun to my head. I've used Trade Ideas, so that's what I'm familiar with. There's also MadScan out there which I think is very similar, but I'm not sure since I've not used it myself.
I don't know if this is something "fresh" or if there are other folks already using a product in this way. And I'm referring to a real time screen that "streams" stock symbols through a window.
These type of scanning services typically offer a first month free (or cheap) trial. Worst case scenario, you can buy a month and see if it's useful and how (or not). Then share your results here good or bad. Open to any questions, feedback or additional ideas related to the topic!
Here's a couple of links (I'm sure there are other good ones out there as well):
www.trade-ideas.com
www.madscan.com
Thanks MM...I could see how this might be useful. I wonder how the noise from the Pit would mimic this ?
Emini Day Trading /
Daily Notes /
Forecast /
Economic Events /
Search /
Terms and Conditions /
Disclaimer /
Books /
Online Books /
Site Map /
Contact /
Privacy Policy /
Links /
About /
Day Trading Forum /
Investment Calculators /
Pivot Point Calculator /
Market Profile Generator /
Fibonacci Calculator /
Mailing List /
Advertise Here /
Articles /
Financial Terms /
Brokers /
Software /
Holidays /
Stock Split Calendar /
Mortgage Calculator /
Donate
Copyright © 2004-2023, MyPivots. All rights reserved.
Copyright © 2004-2023, MyPivots. All rights reserved.