ESshort term trading 4/7/10
reviewing the longer term bias... i have been looking for higher prices into mid to late april, so far ,so good. But we are now getting to a very 'dangerous area' as we approach 1200. we are ripe for a decent decline (at least 25 handles or more). the 15th is beginning to look like an important area time wise. however, given all this, the bullish trend has to be respected untill proven otherwise..... following are twoApril sesonality charts courtesy of Mike Burk. One covers years from 1963 to now and the other , a longer timerame. The main point here is the negative sesonality the 2nd half of the month.
very cool day...as long as they can keep it below that evil 82 - 83 area now then they will print 76.50 today
my day is ending at 74.50 today....72.50 is another breakout point but I have no contracts...on upside is 78.50 and 81.50...no trades from here and no good read now..
Always fascinating to me when they hit the SPLIT numbers...those numbers between the 00, 25, 50 and 75...so yesterdays highs at 87.50 was a split because it fell between 1175 and 1200...needs to be a strategy around that..."if I only had a brain"
Always fascinating to me when they hit the SPLIT numbers...those numbers between the 00, 25, 50 and 75...so yesterdays highs at 87.50 was a split because it fell between 1175 and 1200...needs to be a strategy around that..."if I only had a brain"
Great trading ,Bruce! wow, they took it all the way to the 1172.50 almost! Fun day .. my bias was to the short side but made my handles on longs, lol. Always doin it the hard way. see everyone tomorrow and thx for the contributions!
Originally posted by koolblue
Click image for original size
Hi Koolblue.
I know it is a bit late but I wanted to thank you for posting the chart(s) on 04/07/10
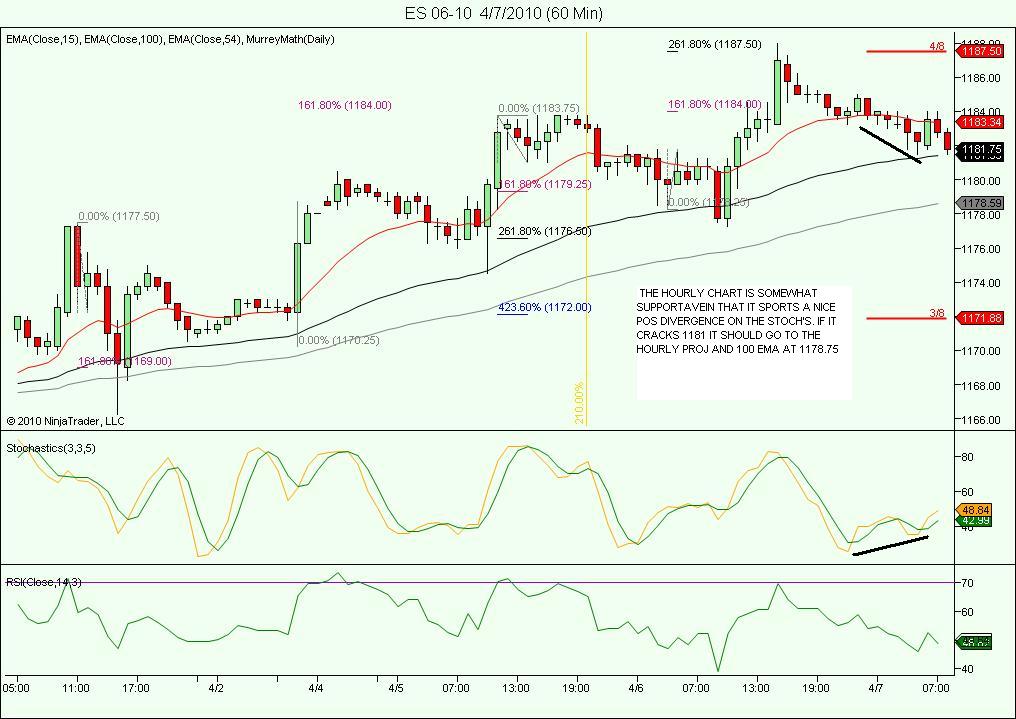
One chart you posted with the 1171 as possible support was outstanding! Right on support too! A turning point.
Thanks again for sharing the way you see!
h
Emini Day Trading /
Daily Notes /
Forecast /
Economic Events /
Search /
Terms and Conditions /
Disclaimer /
Books /
Online Books /
Site Map /
Contact /
Privacy Policy /
Links /
About /
Day Trading Forum /
Investment Calculators /
Pivot Point Calculator /
Market Profile Generator /
Fibonacci Calculator /
Mailing List /
Advertise Here /
Articles /
Financial Terms /
Brokers /
Software /
Holidays /
Stock Split Calendar /
Mortgage Calculator /
Donate
Copyright © 2004-2023, MyPivots. All rights reserved.
Copyright © 2004-2023, MyPivots. All rights reserved.