ES Short Term Trading 4/9/10
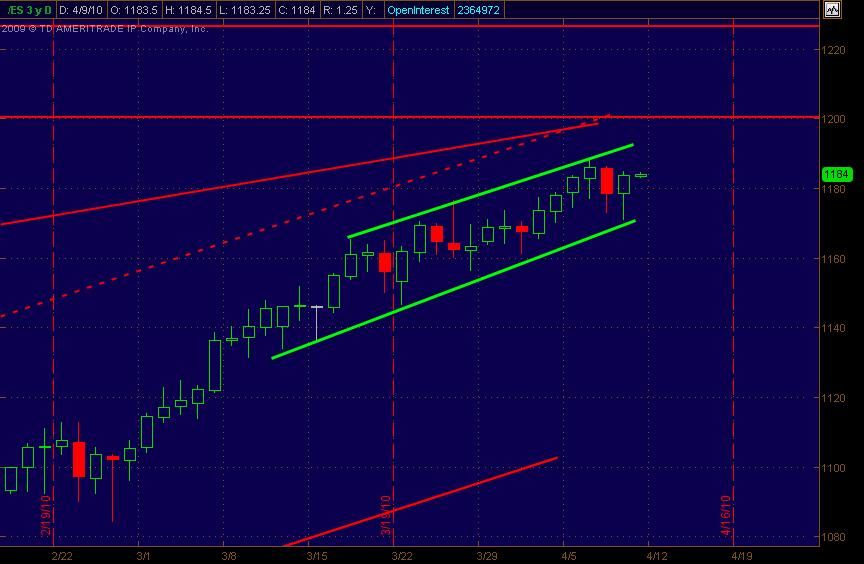
Thought I'd go ahead and launch the topic/thread for Friday's trading. I'm posting what I'm seeing with Price Action S/R levels on the Daily and also 1-Hour charts. Other price trendlines/chanels also included. Looking forward to the interaction from Thursday's trading and analysis.
Side note: It still seems that no matter what the mkt news is, price keeps rallying (hard and fast), especially when looking at a 30 or 60 min chart on the ES. It's almost cyclical when just eyeing it. I do have 1200 as a significant upside price resistance (don't most folks!?!).
Anyway, here's the goods ... my map for what I'm looking at for trading both the ES and a "map" that aids my stock trading.
Daily ES Chart:
Click image for original size
Originally posted by PAUL9
I just reviewed some notes... my original desription was a little off.
my note,
***********************
Don's favorite set-up is described in 03/09/09 TD blog:
1) monster decline previous day
2) next day, gap down to prior day support, BUY tick under -720
***********************
pieces of this were in place yesterday, had a big decline (relatively speaking), gapped lower at open, regestered under negative 720 $Tick at price of near 73-72, at 9:37am
don't quote me exactly, but if you go to his blog and research post for TD (Trade Day) 3/9/9 might find better description.
Well, I have to eat my words.... 3/9/09 was an established downtrend.... and his pattern still worked! Need to remember that one....
Hi Paul,
Did Don ever talk about the inverse of that working? ie.
1) monster run-up previous day
2) next day, gap up to prior day resistance, BUY tick over +720
This pretty much describes what happened today just after the 10am reversal time......
Did Don ever talk about the inverse of that working? ie.
1) monster run-up previous day
2) next day, gap up to prior day resistance, BUY tick over +720
This pretty much describes what happened today just after the 10am reversal time......
Click image for original size
Does it work the other way?
I'm Sorry, phileo, I can't really say. I only read Miller for about 2 months in the beginning of 2009 when PA was so exaggerated.
I'm Sorry, phileo, I can't really say. I only read Miller for about 2 months in the beginning of 2009 when PA was so exaggerated.
Originally posted by phileo
Hi Paul,
Did Don ever talk about the inverse of that working? ie.
1) monster run-up previous day
2) next day, gap up to prior day resistance, BUY tick over +720
This pretty much describes what happened today just after the 10am reversal time......
Sorry, I meant:
2) next day gap up to prior resistance, SELL tick over +720
Click image for original size
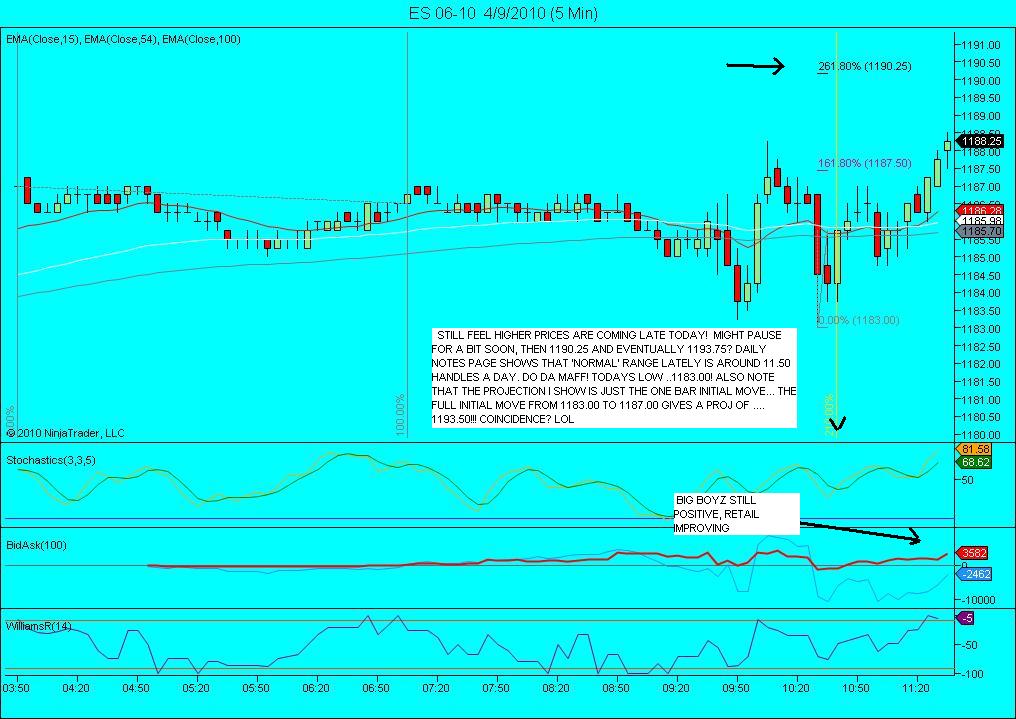
Hope somebody took advantage of those calls for 1188 and sold! Great call guys!
Hi Koolblue,
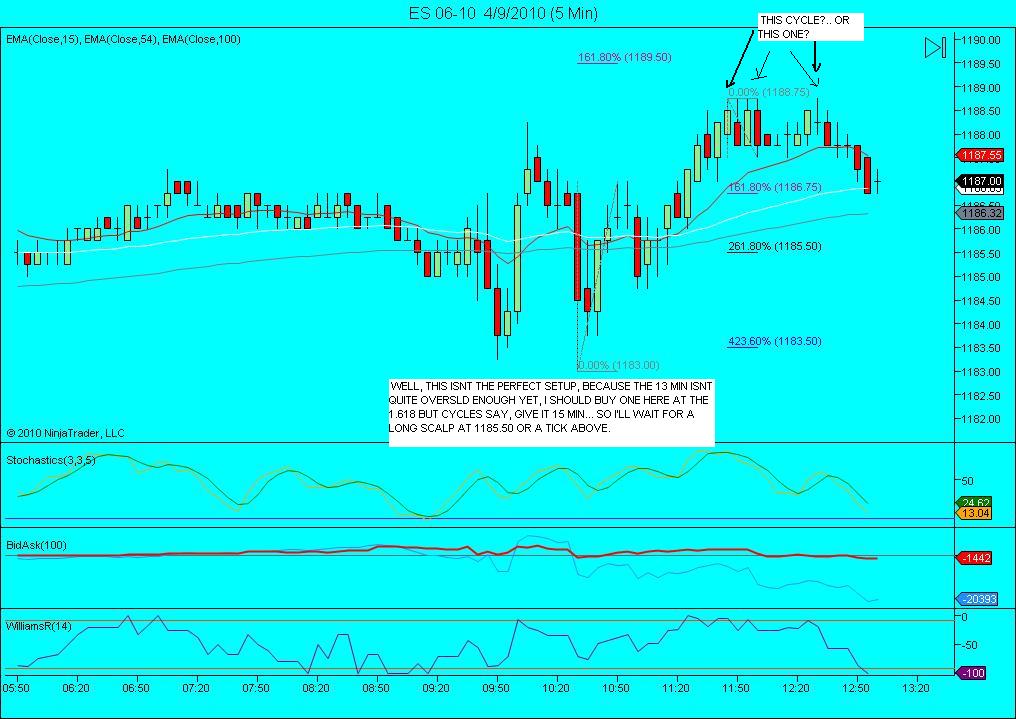
i dunno, a long 1185.5 doesn't look very appealing to me at this point..... barely took out session high, and now back in mid-range. momo gone at the very least
I'm actually thinking about shorts.... let's see if they can take back up to o/n hi
i dunno, a long 1185.5 doesn't look very appealing to me at this point..... barely took out session high, and now back in mid-range. momo gone at the very least
I'm actually thinking about shorts.... let's see if they can take back up to o/n hi
probably right ,pal! Dont like the action, but the technicals are ok and the price proj was hit hoping for a couple handle bounce!
covered one to reduce risk at 1186.75..plus 1.25 and i'll let the other go, looking for 1188.00
Just wanted to add my 2 cents on this MATD pattern...
What I look for after a trend day is the market to enter a phase of "price acceptance" as the market develops a well defined value area in MP terms.
The key for me is to see the primary intraday moving averages flatten out and price to cross back and forth across the averages right off the open. Basically the market will spend several hours going nowhere. I like to see long full candle bodies on the 5 and 15 minute time frames, color is not important.
The nice thing about the MATD is the two way trading returns to the market, (as opposed to the one sided market on a trend day). This enables the scalpers to make money going both ways, fading the edges of the newly developing value area. IF you can identify where these edges are in advance, you have a significant trading edge and profit opportunity (assuming you know how to buy support and sell resistance). Also, a word of advice, avoid the mistake of initiating new trades in the middle of developing value. Be patient and stick to the edges.
Emini Day Trading /
Daily Notes /
Forecast /
Economic Events /
Search /
Terms and Conditions /
Disclaimer /
Books /
Online Books /
Site Map /
Contact /
Privacy Policy /
Links /
About /
Day Trading Forum /
Investment Calculators /
Pivot Point Calculator /
Market Profile Generator /
Fibonacci Calculator /
Mailing List /
Advertise Here /
Articles /
Financial Terms /
Brokers /
Software /
Holidays /
Stock Split Calendar /
Mortgage Calculator /
Donate
Copyright © 2004-2023, MyPivots. All rights reserved.
Copyright © 2004-2023, MyPivots. All rights reserved.