ES Short Term Trading 4/19/10
Here's my Price Action S/R levels in Red with minor ones in Magenta. It's on a 30min bar ES chart. Sunday night's mkt just opened when I snapped the screenshot. Also, there's an upward sloping trendline in Cyan fwiw.
Click image for original size
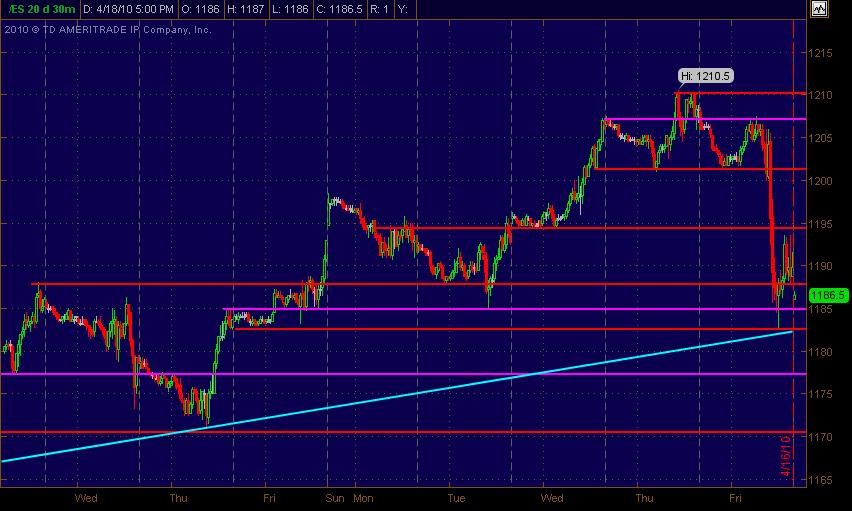
Noticing several have posted potential support prices in the high 1160's and high 1170's. Just an fyi, the Daily and Weekly S1 and S2 are both in the same areas: S1 @ 1178-79 ... S2 @ 1167-68
previous month H also offering support (monthly RTH H) of 1176.50.
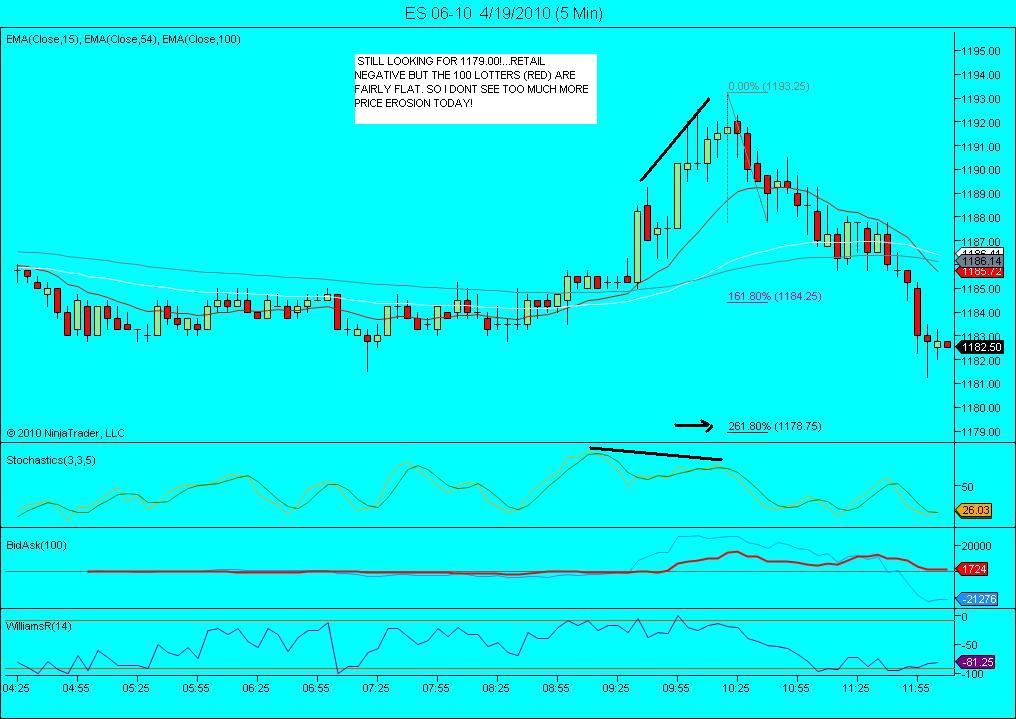
price dropped so much on Friday (relatively speaking it was over 2 times the average RTH range of the prior 5 trade days) that often, the O/N low could have done the dirty work of posting the low for the 24hour prices.
Many times, I have seen big drops generate Lower Lows in the ensuing AH and then true frustration for new short-sellers in the RTH as price makes only one small 5min dip (that doesn't even take out the AH L) and then price rises as Friday Bears book profits.(sometimes this kind of PA only lasts first half of RTH day and can end with a fill of the immediate gap ) or a move to the pivot in the low 90's
strong resistance at 1193.00 area. It is also a P.P. for today.
bullish tone to the morning session thus far. buyers absorbed a lot of negative conditions off the open. But now I see a triple top 1193. That could be the new line in the sand.
Forgot to mention that it's mutual fund monday, where over 76% of all Monday's since Jul/09 have closed > open. Today's open=1186.
Forgot to mention that it's mutual fund monday, where over 76% of all Monday's since Jul/09 have closed > open. Today's open=1186.
Originally posted by phileo
Forgot to mention that it's mutual fund monday, where over 76% of all Monday's since Jul/09 have closed > open. Today's open=1186.
I assume the theory here is that Mutual Funds are buying on Mondays. Why would Mutual Funds being doing that now, or at least over the last 9 to 10 months?
Click image for original size
Click image for original size
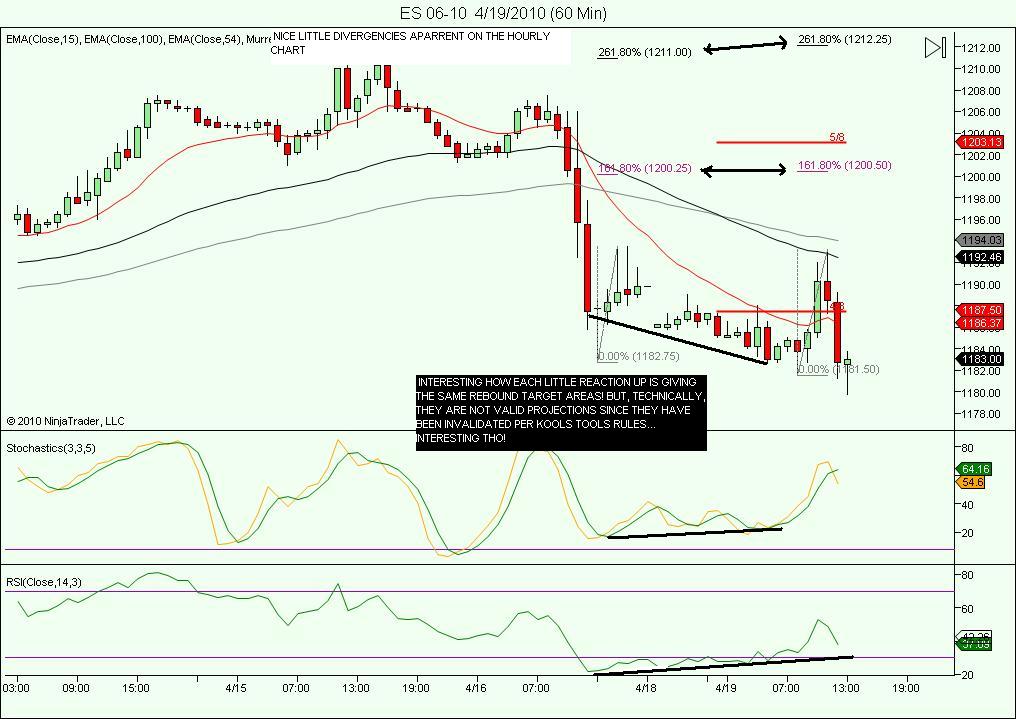
Testing Friday's low as S/R. it should zig-zag a bit in the minor t. frames till the isolators move out of the oversold condition. Then, down we go towards the 1166.00 objective.
The 1193 resistance we spoke about this morning, is now the voiding point for the above.
The 1193 resistance we spoke about this morning, is now the voiding point for the above.
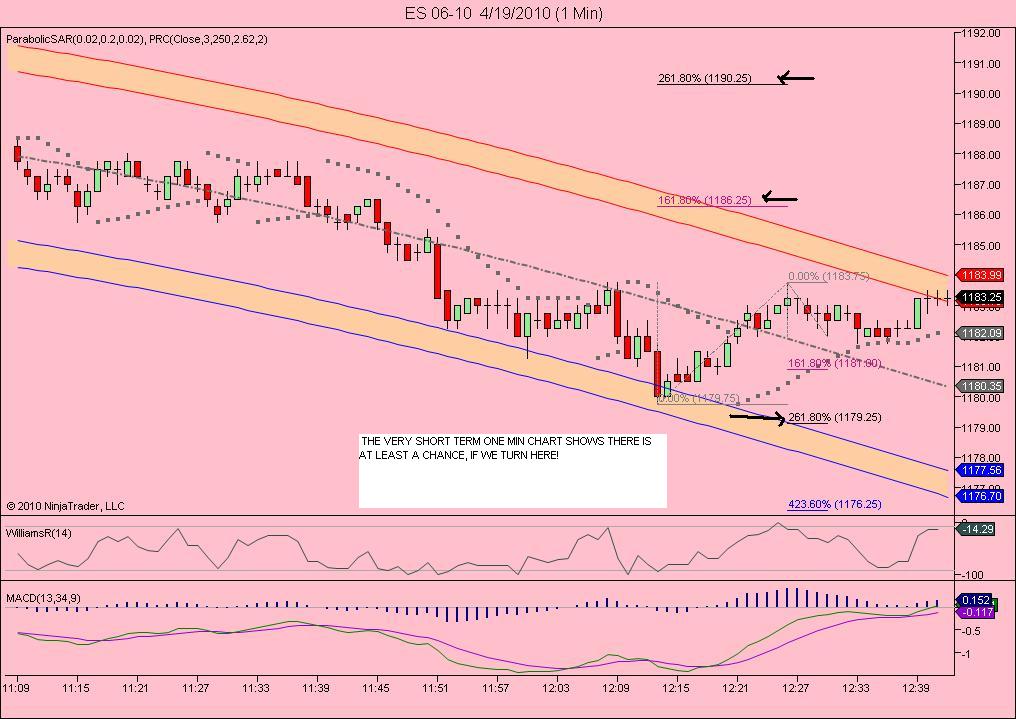
WELL, HECK! Bingo ,kinda on 1179? Is that all ? or do we contiue down? If so , next resistance would be arpound 1177 and change . I have no freakin clue , except that i just doubt we'll see my 1167 and change or Hunters 1166 today...but i guess time will tell!
Click image for original size
Thanks for the link pt_emini. In case anybody wants to track this over a longer period of time I've started a topic here Mutual Fund Mondays.
Emini Day Trading /
Daily Notes /
Forecast /
Economic Events /
Search /
Terms and Conditions /
Disclaimer /
Books /
Online Books /
Site Map /
Contact /
Privacy Policy /
Links /
About /
Day Trading Forum /
Investment Calculators /
Pivot Point Calculator /
Market Profile Generator /
Fibonacci Calculator /
Mailing List /
Advertise Here /
Articles /
Financial Terms /
Brokers /
Software /
Holidays /
Stock Split Calendar /
Mortgage Calculator /
Donate
Copyright © 2004-2023, MyPivots. All rights reserved.
Copyright © 2004-2023, MyPivots. All rights reserved.