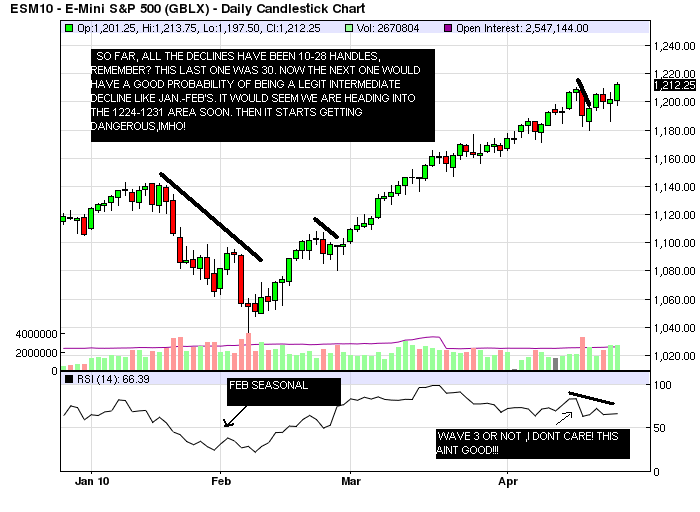
Weekend preview ES short term trading 4/24/10
First a quick review..We had a Kools turn cycle due the 15th. We were dead on! The price, however we missed (looked for 1207 or so) by 3 handles. I thought the normal 10-28 handle decline was the most likely outcome and we got that to 1179.75. Now im suspecting a more serious decline may now finally be fast aproaching within the next 2 weeks.At least that seems the most likely scenerio, given the cycles,and seasonals...
Click image for original size
I learned the 128% from Larry Williams some time ago. ( L.W. rounds up the 127.8 ) Have done some work with time and price meaning exact time, exact price with some luck. Much. much work needs to be done to increase the % of hits.
Originally posted by koolblue
Click image for original size
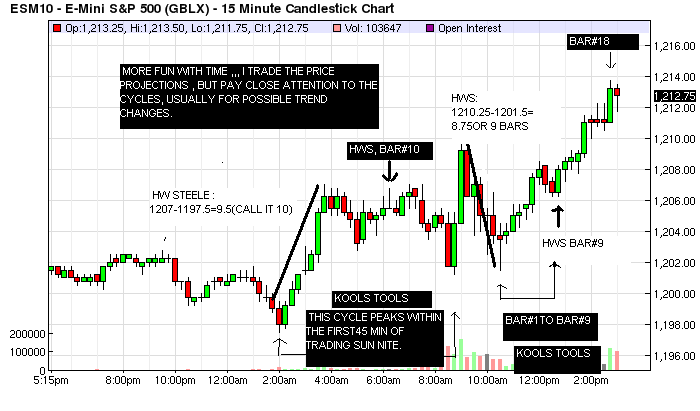
Great work koolblue.
If I'm interpreting your bar#18 correctly, it is suggesting a pullback, correct?
Monday is the confluence of two special patterns:
Mutual Fund Monday (+88% probability of close > open since sep/09)
MATD (oscillations post trend day, ie. both buy and sell sequences will appear). This is don Miller's famous strategy, the specifics of which has been discussed in this forum in prior threads. I will be keying in on those specific tactics for Monday.
Anyways, here's my homework for Monday:
Click image for original size
One number that sticks out for me (1206.75) ties in nicely with your 1207 support number that you mentioned earlier.
And another perspective of the week that was:
Click image for original size

If we gap up in GLOBEX and open above 1214, then Friday's hi (1213.75) could be a potential inflection point as well.
I don't see any decent resistance on the charts (maybe 1218?), perhaps others can add to the analysis.
Originally posted by koolblue
No, i really havent ,Hunter. I'll have to defer to Jim Kane, the 'father' of the 1.127 and 0.886 ratio's. he has done extensive work with these.Incidently ,his web site is a wealth of imformation , and i advise all to check it out.
Thanks for the sentiment there, kool, I really appreciate it. I'm enjoying following your work here daily. It's great to see this kind of work here at mypivots, and to see fibs get such a legitimate treatment (and acceptance), compared to the junk we so frequently see on fibs. As far as what Hunter was mentioning, he was referring to a 1.28 and not the 1.128 from my work, hence the Williams reference.
THank you for correcting my error, I did not see it till now.
Most of my work is done with fibs horizontally and vertically. They always give me a view of the probabilities ahead,
Most of my work is done with fibs horizontally and vertically. They always give me a view of the probabilities ahead,
Originally posted by jimkane
Originally posted by koolblue
No, i really havent ,Hunter. I'll have to defer to Jim Kane, the 'father' of the 1.127 and 0.886 ratio's. he has done extensive work with these.Incidently ,his web site is a wealth of imformation , and i advise all to check it out.
Thanks for the sentiment there, kool, I really appreciate it. I'm enjoying following your work here daily. It's great to see this kind of work here at mypivots, and to see fibs get such a legitimate treatment (and acceptance), compared to the junk we so frequently see on fibs. As far as what Hunter was mentioning, he was referring to a 1.28 and not the 1.128 from my work, hence the Williams reference.
Opened lower this evening at about 10.75 should be an interesting evening
Great charts and comments guys. Thanks.
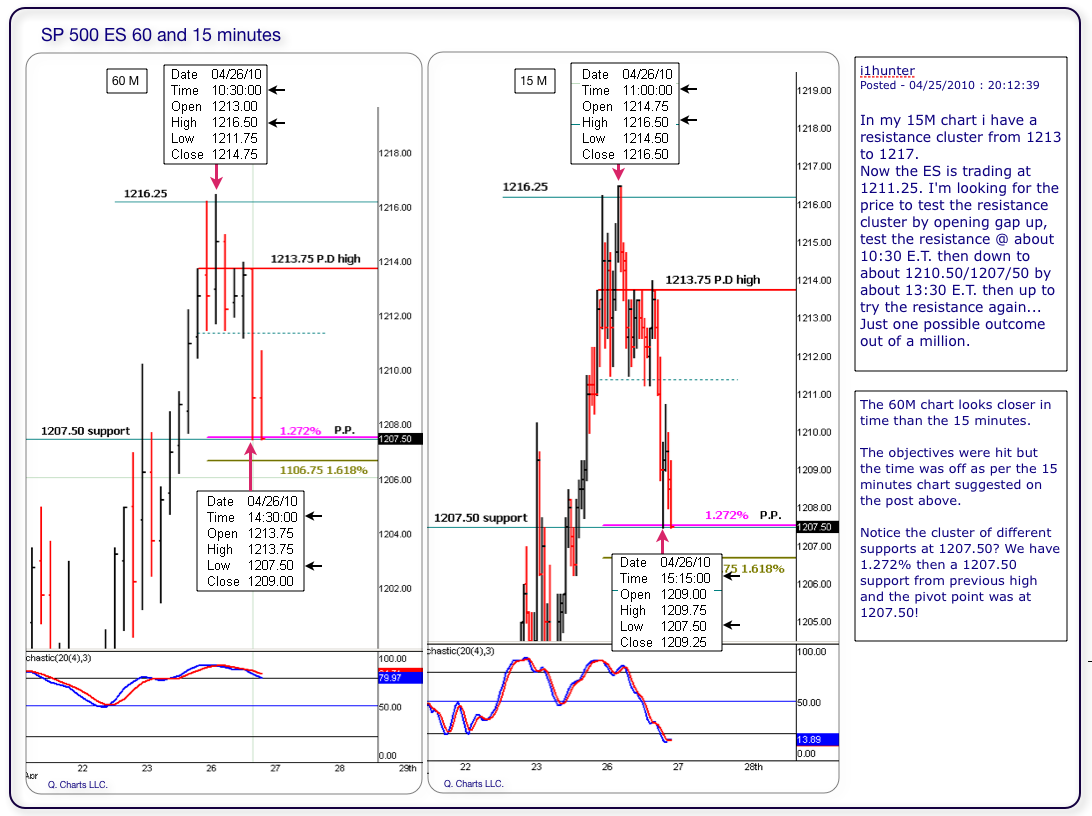
In my 15M chart i have a resistance cluster from 1213 to 1217.
Now the ES is trading at 1211.25. I'm looking for the price to test the resistance cluster by opening gap up, test the resistance @ about 10:30 E.T. then down to about 1210.50/1207/50 by about 13:30 E.T. then up to try the resistance again... Just one possible outcome out of a million.
Will see what setups it gives us.
I see for you the same I see for my self: Having the very best of luck and most profitable trading adventure!
I got 1216.25 as the overnite high got a short in at 1216 lets see if it gets there.
I'm assuming you were voted down because you didn't say "why" you had the 1216 as the overnight high Rich...so I'm officially asking..
The challenge with posting while trading is that sometimes there isn't time to give much of an expalination. So the question becomes how much time do we give someone time to explain a trade area or a number that may come up dynamically during a trade session to explain themselves ?
For me I'm short 14.75 on that volume thrust to target 11.75....no time is spent at 11.75 so this is the efficient market theory..no price overlap there....YET!
Bruce, my thinking goes this way I had the high of Friday at 1213.50 then I figured if it broke out the next level would be 1216.25 I just add 2.75 and it came to 1216.25. Seems like adding 2.75 seems to work for the next resistance. Had a bracket of 3.25 loss and profit of 1.75 it worked last night.
Thanks Rich...
Since I did posted the time and price, I feel that a follow up is good so we can see if it was a total screw up or if it did had merit to it. Still much work needs to be done since it is a very complex matter.
Click image for original size
Emini Day Trading /
Daily Notes /
Forecast /
Economic Events /
Search /
Terms and Conditions /
Disclaimer /
Books /
Online Books /
Site Map /
Contact /
Privacy Policy /
Links /
About /
Day Trading Forum /
Investment Calculators /
Pivot Point Calculator /
Market Profile Generator /
Fibonacci Calculator /
Mailing List /
Advertise Here /
Articles /
Financial Terms /
Brokers /
Software /
Holidays /
Stock Split Calendar /
Mortgage Calculator /
Donate
Copyright © 2004-2023, MyPivots. All rights reserved.
Copyright © 2004-2023, MyPivots. All rights reserved.