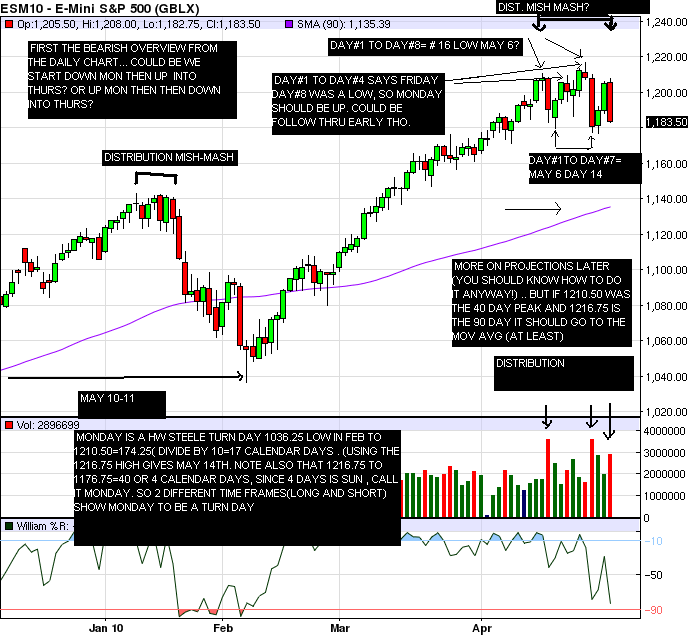
ES short term trading- Weekend preview 5-01-10
Click image for original size
Click image for original size

Click image for original size
...Class dismissed!
Click image for original size
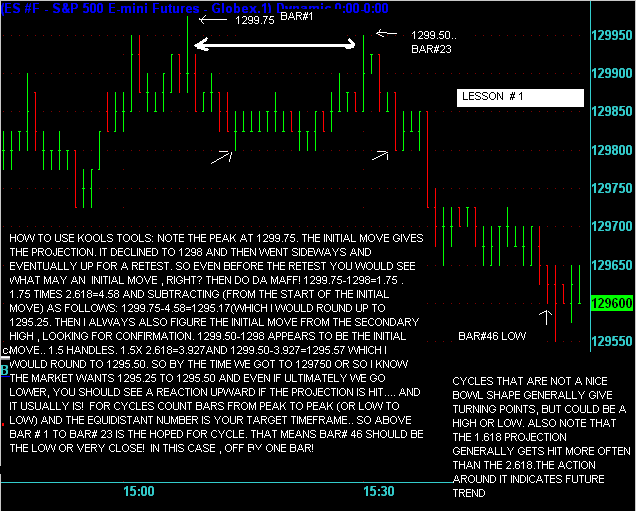
Good explaination KB, I voted it up. Now what I can't understand is that I see you use different time frames. I see you use 1/5/15/13/120min charts. This confuses me as to what to use when. Also you are suggesting that market needs to react at 1.618/2.618/3.618/4.618 and so forth levels provided it hits that projection at the end of the time cycle, confluence of events and numbers. My suggestion is that we use 1 min chart standard. Could someone please post the 1 min chart for 30/04 from 8.30 est to end of day. Lets see if we can figure something out amalgamating KB, pitbull and my mumbo jumbo.
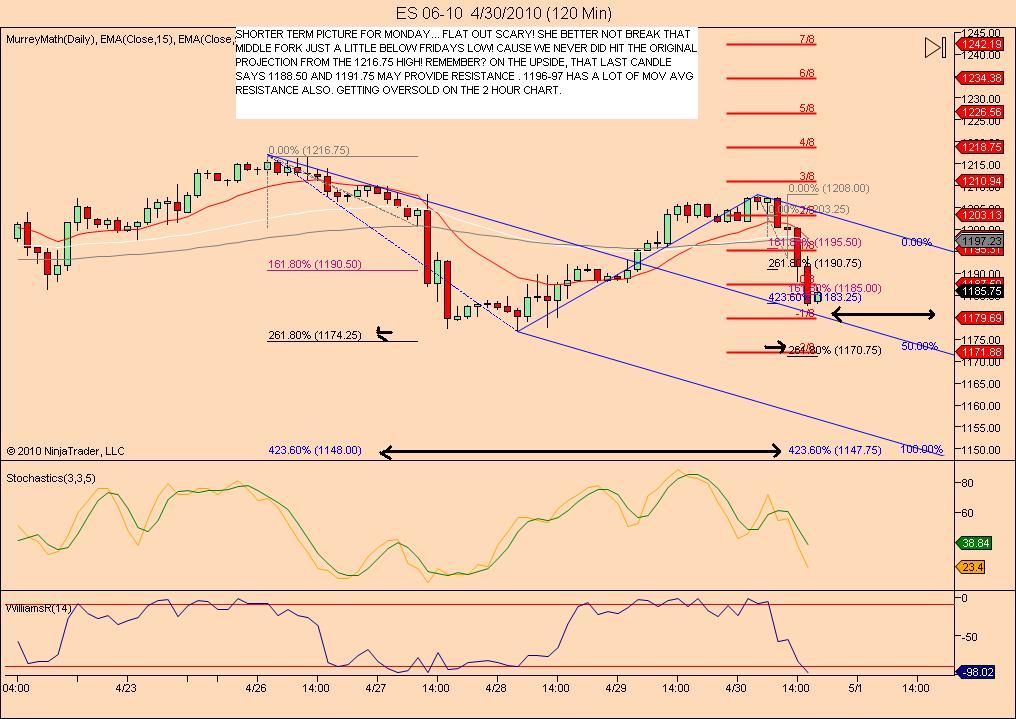
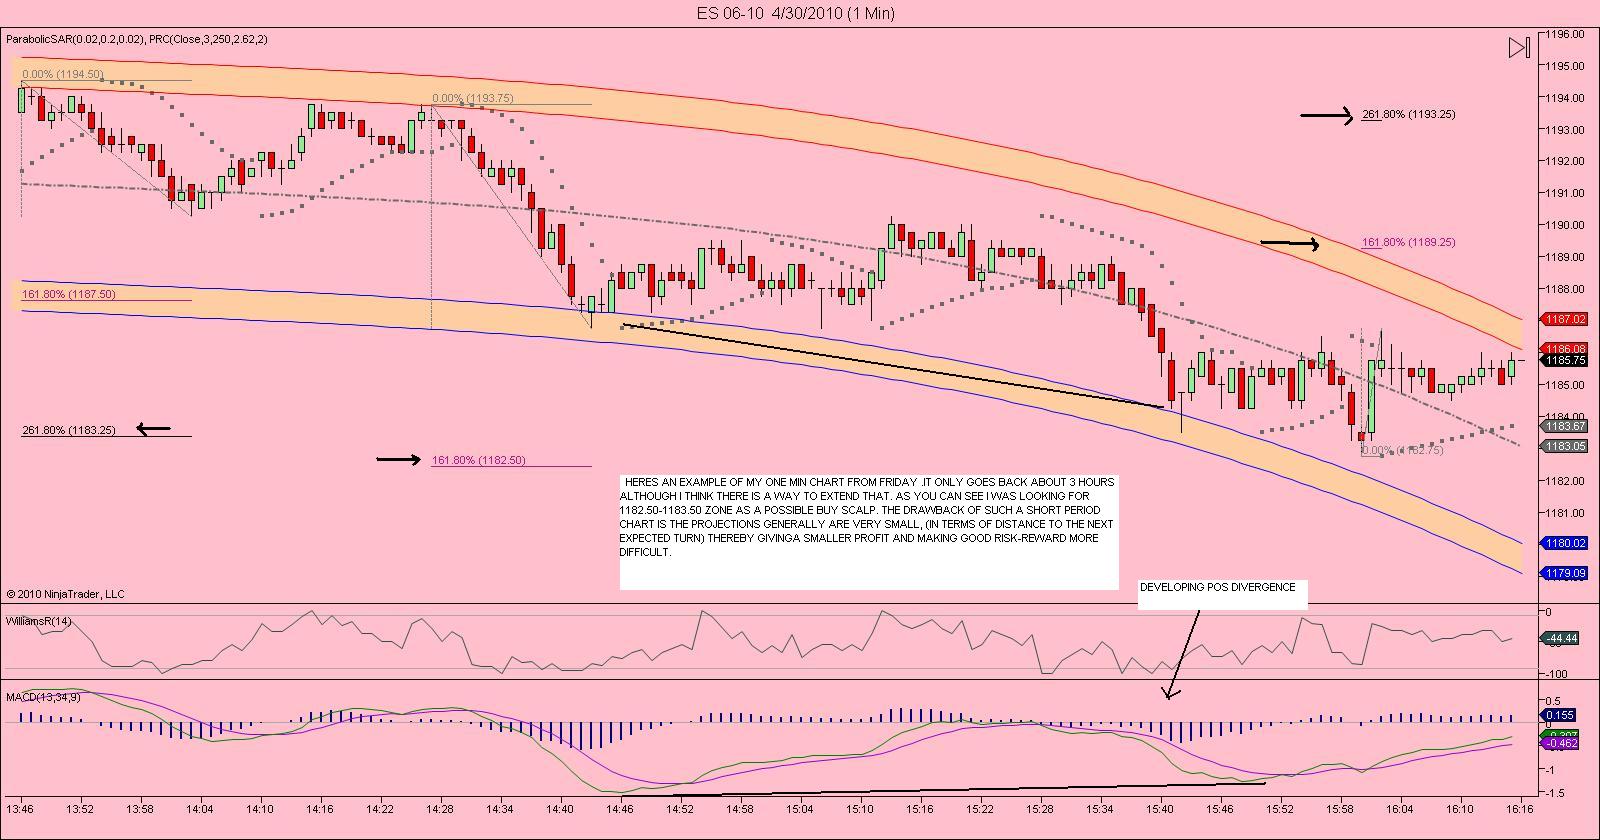
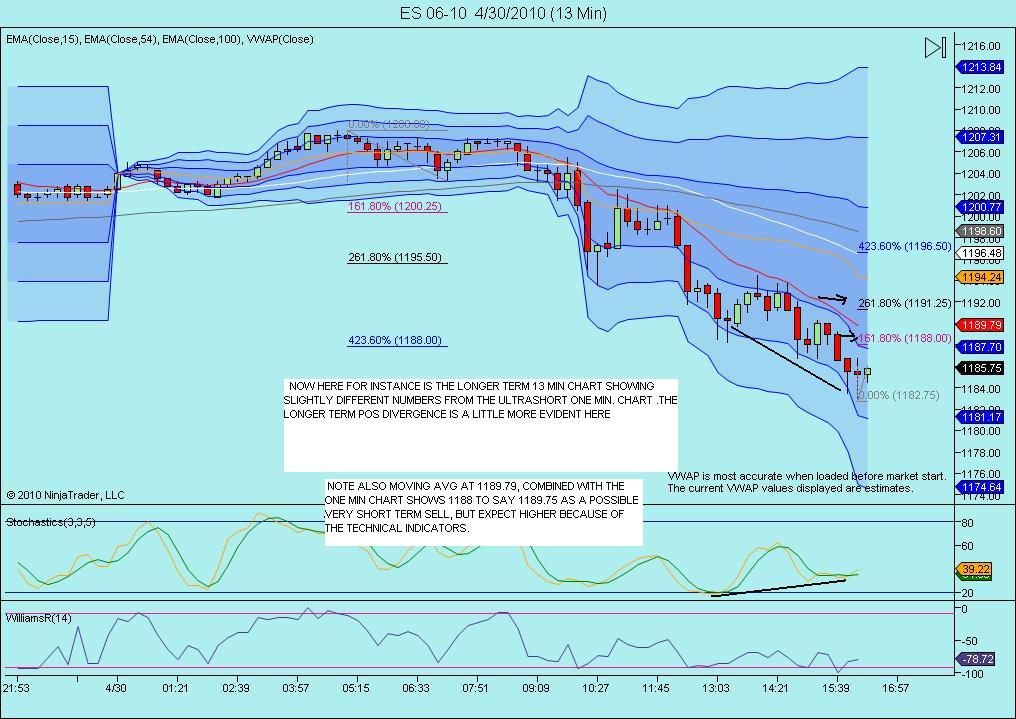
thx AK,by way of explaination, i use 120 and hourly charts for the longer term picture( meaning 1-3 days or so) and i use 13 min basically for the main trend(one day or so) and the 5 min and one min to trade off of.These short term charts are good for 5 min to an hour or so. obviously the 5 min and one min are generally more accurate than a 2 hour chart, but i like to refer to the 'bigger' picture from time to time, like this weekend , where i showed the main projection from the rally high days ago(1216.75) is still outstanding! But the short term charts are what i spend most of my time looking at.
Click image for original size
Click image for original size

. Now its not shown, but if we head straight down sun nite then i would be looking at that 1179.75-1181 area to hold. (1179.75 from the 13 min vwap and one min proj from 1186.75 to 1184.50=2.25x 2.618 gives 1180.86). Also the middle fork on the 2 hour chart around 1179.75......Click image for original size
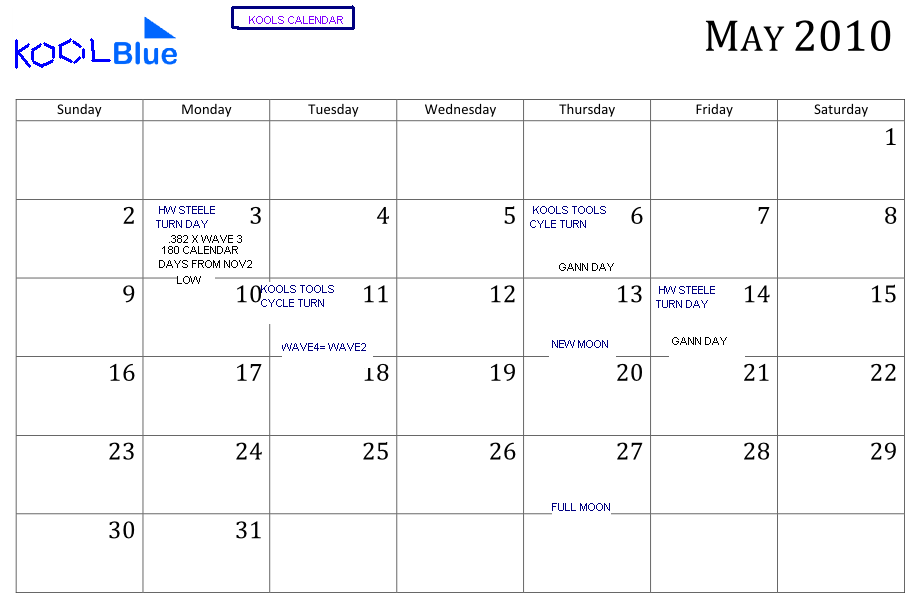
And introducing Kools Calendar....
Click image for original size
kool good charts thanks
Agree,,,lets make sure we vote them up!!
Originally posted by richd8980
kool good charts thanks
What I meant to say is:
last week were the #s 1203 1188 1189 trading in an area of air
then when you ran the profile this area was a high volume area
last week were the #s 1203 1188 1189 trading in an area of air
then when you ran the profile this area was a high volume area
Emini Day Trading /
Daily Notes /
Forecast /
Economic Events /
Search /
Terms and Conditions /
Disclaimer /
Books /
Online Books /
Site Map /
Contact /
Privacy Policy /
Links /
About /
Day Trading Forum /
Investment Calculators /
Pivot Point Calculator /
Market Profile Generator /
Fibonacci Calculator /
Mailing List /
Advertise Here /
Articles /
Financial Terms /
Brokers /
Software /
Holidays /
Stock Split Calendar /
Mortgage Calculator /
Donate
Copyright © 2004-2023, MyPivots. All rights reserved.
Copyright © 2004-2023, MyPivots. All rights reserved.