ES Short Term Trading 5-4-10
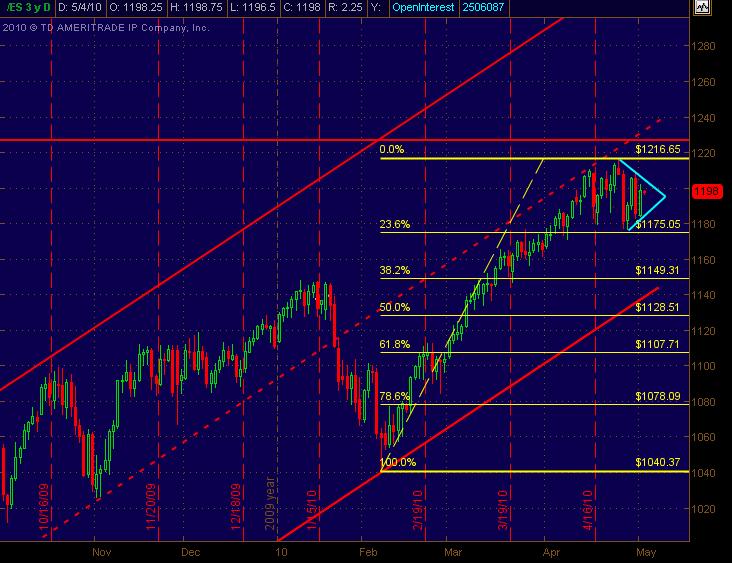
I'm still trying to get used to Thinkorswim, but here's a basic big pic overview of the Daily ES chart. Have the the trend channel and also included Fib Retracement levels though I don't typically use them much ... but nice to know where they are. And Kool and others have referenced the sideways pattern that I've thrown Cyan lines on as a pennant type formation ... even though it's not so much price swings creating it as it is the volatility increase and Wider Range trading sessions of overlapping bars. Hope this is helpful.
Click image for original size
added at 67.50 but willnot add a second time today...targeting 72.50
RTH range so far is 15.5, that is about average for the past few days. But to me, that's not a signal to buy, as buyers clearly are not in control.
Markets are too emotional right now.
TICK dipped to -1220 just now, usually that marks a peak in selling, but it's pretty scary for me to buy at these levels, I'd rather sit on the sidelines and wait.....
Markets are too emotional right now.
TICK dipped to -1220 just now, usually that marks a peak in selling, but it's pretty scary for me to buy at these levels, I'd rather sit on the sidelines and wait.....
Mine was generated by the pivot indicator on Thinkorswim and differed from what was posted on mypivots for Daily S2 for some reason.
Geeeeeeez ... we're testing the 50 day sma on my daily chart (@ 1167 on my software) it seems. Like I said earlier, things looked like they were gonna get NASTY unless ya were short
Geeeeeeez ... we're testing the 50 day sma on my daily chart (@ 1167 on my software) it seems. Like I said earlier, things looked like they were gonna get NASTY unless ya were short
Originally posted by BruceM
I have daily S2 at 76.50
Click image for original size

weekly s1 is 67.75 this week.....so far the weekly numbers based on Volume etc have been payed attention to....sure didn't help me much so far today...lol
Originally posted by phileo
RTH range so far is 15.5, that is about average for the past few days. But to me, that's not a signal to buy, as buyers clearly are not in control.
Markets are too emotional right now.
TICK dipped to -1220 just now, usually that marks a peak in selling, but it's pretty scary for me to buy at these levels, I'd rather sit on the sidelines and wait.....
Actually, that was TICK = -1346, and of course, in hindsight, it looks like a great place to go long. But it was pretty scary at the time, and I had already had a losing trade.
got 71.75 and that makes the day ok...now if only they could go get 76 before new lows I'll be real happy ...we all see that the 76 was unfair...so take off your shorts and let it go up...
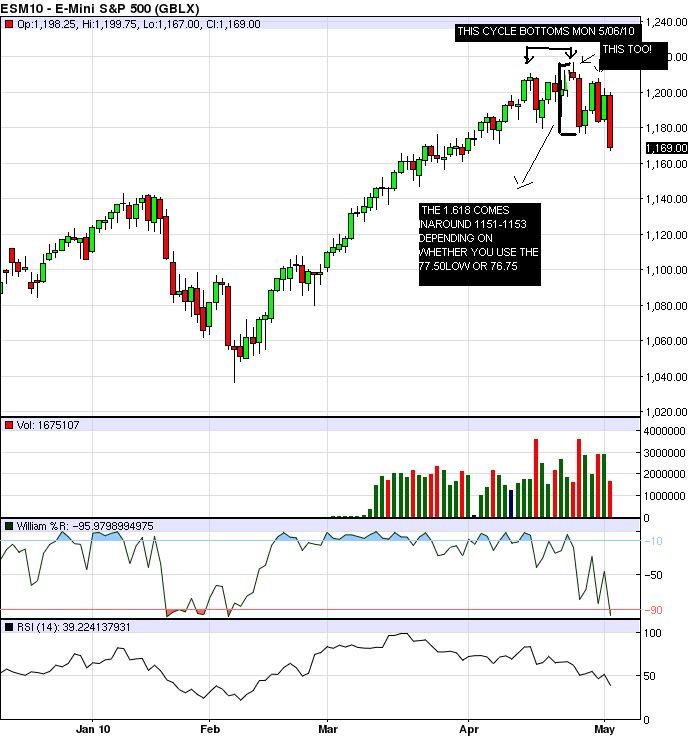
Longer term look see! As stated i think we bottom late friday or early Monday....
Click image for original size
71.50 and 76 .25 need work.....lets go get em....
If ES can move above the 72.25 level, pattern of downside will be temporarily broken because the current lift DID NOT put in another air bar down.
Bruce I find him to be the most thoughtful, accurate and flexable analyst I have ever seen. His Sat audio updates are complete and concise. He has been calling for March 20 high to be followed by a short correction leading to an Aug 20 high which you better get out of the way. This call is over 6 mos old. New Lows, maybe and lasting for a major cycle.
Emini Day Trading /
Daily Notes /
Forecast /
Economic Events /
Search /
Terms and Conditions /
Disclaimer /
Books /
Online Books /
Site Map /
Contact /
Privacy Policy /
Links /
About /
Day Trading Forum /
Investment Calculators /
Pivot Point Calculator /
Market Profile Generator /
Fibonacci Calculator /
Mailing List /
Advertise Here /
Articles /
Financial Terms /
Brokers /
Software /
Holidays /
Stock Split Calendar /
Mortgage Calculator /
Donate
Copyright © 2004-2023, MyPivots. All rights reserved.
Copyright © 2004-2023, MyPivots. All rights reserved.