ES Short Term Trading 5-4-10
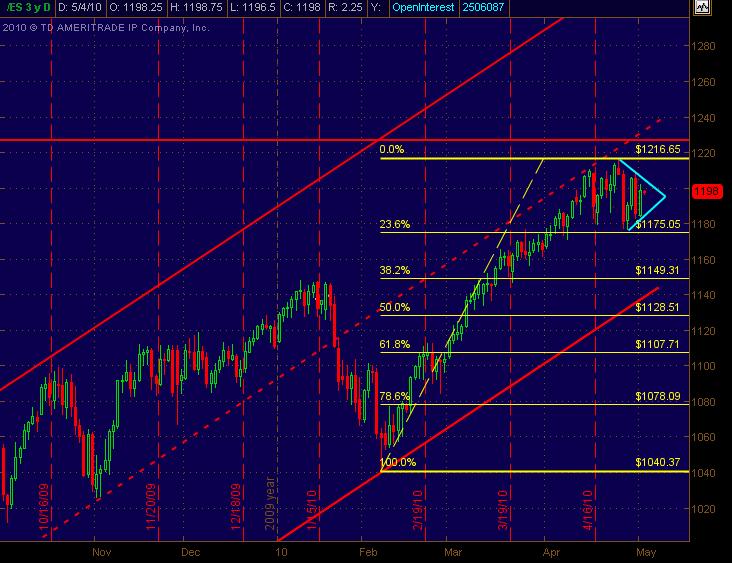
I'm still trying to get used to Thinkorswim, but here's a basic big pic overview of the Daily ES chart. Have the the trend channel and also included Fib Retracement levels though I don't typically use them much ... but nice to know where they are. And Kool and others have referenced the sideways pattern that I've thrown Cyan lines on as a pennant type formation ... even though it's not so much price swings creating it as it is the volatility increase and Wider Range trading sessions of overlapping bars. Hope this is helpful.
Click image for original size
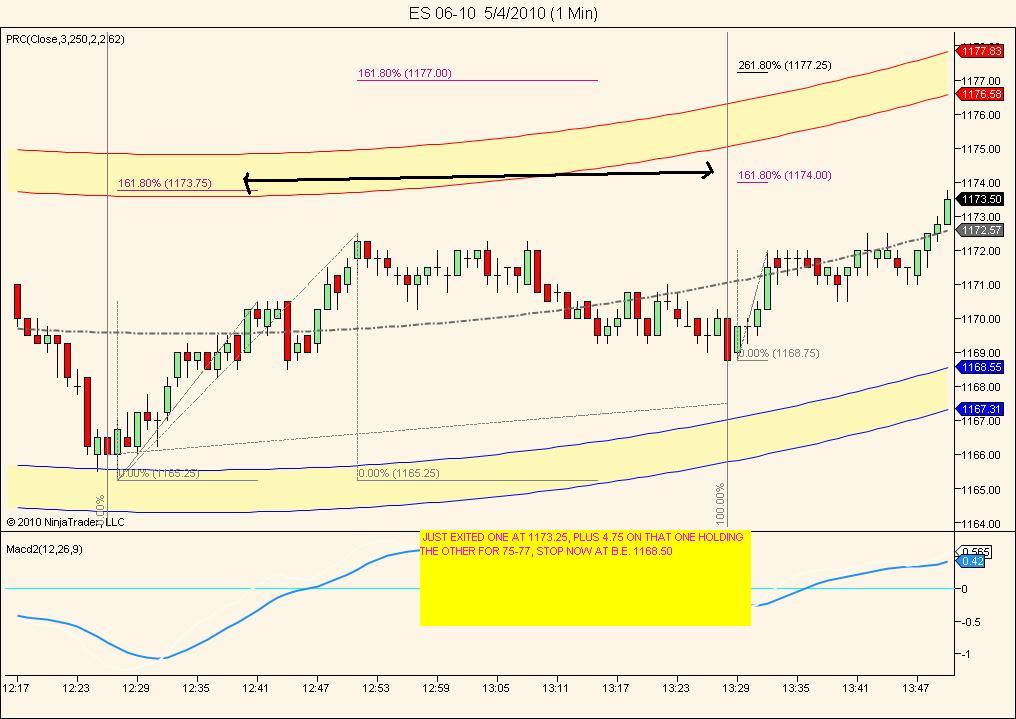
got 71.25...trying for that 75 - 77 with 2 runners left
79 is high volujme node.....with luck it will be the attractor to help out our 75-77 target
im long one at 1169.50 and one at 1167.00 avg long 2 at 1168.25. stop is at 1165.00
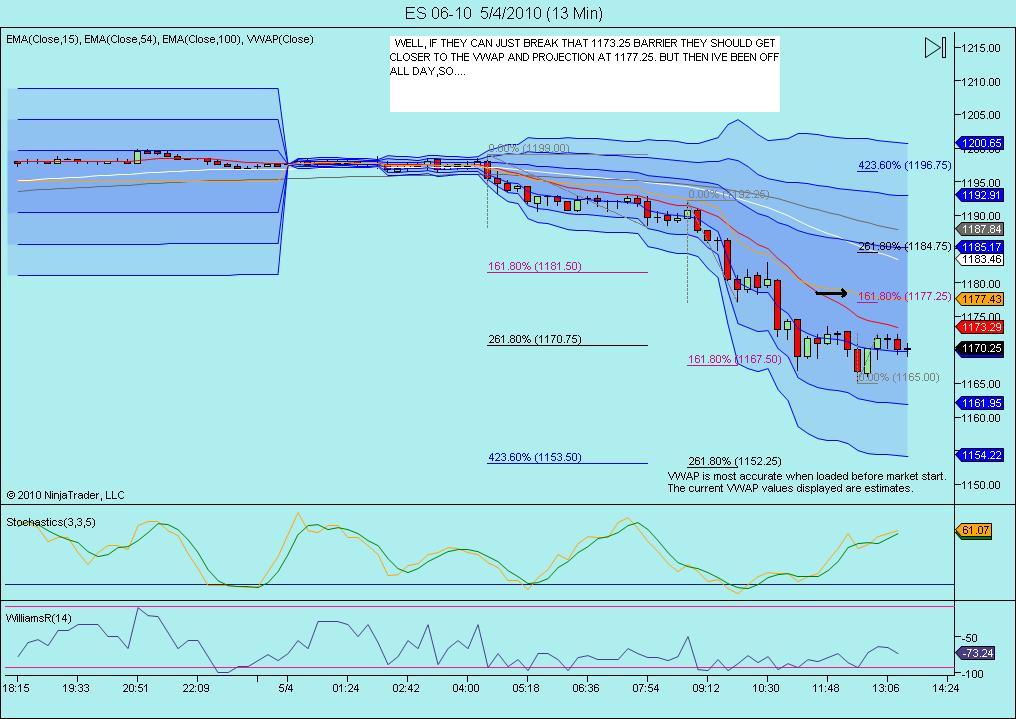
triples still above 72.50....FWIW!!
Click image for original size
Click image for original size
ab = cd is 75.75
Click image for original size
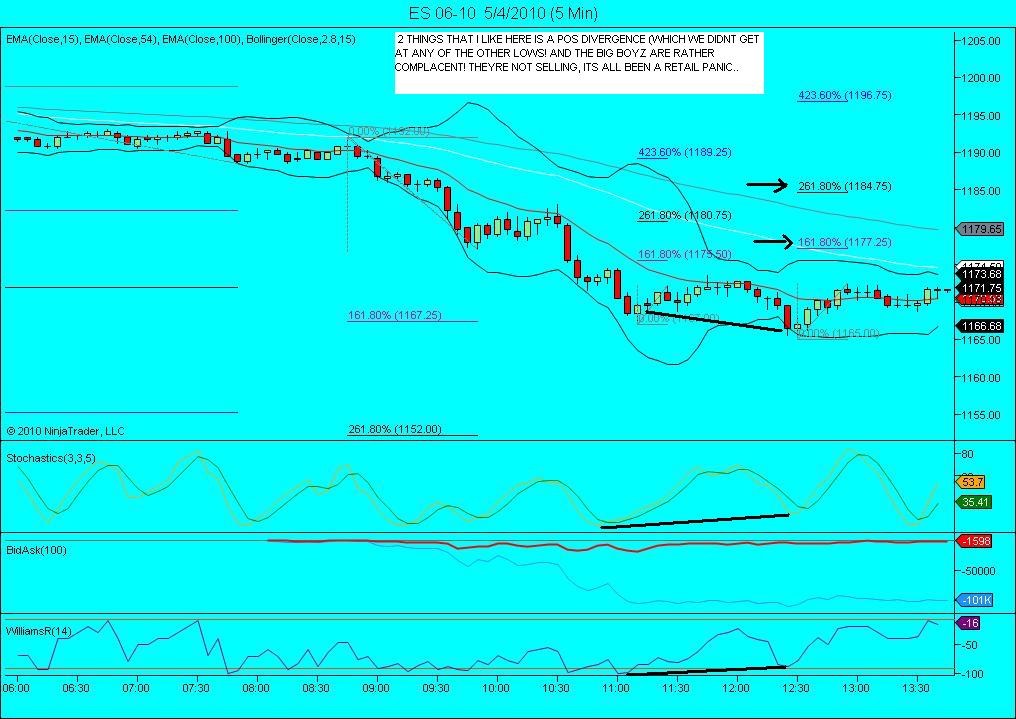
nOTICE O/N THE BLUE 5 MIN CHARTS, THE RED (15EMA) AVG. during the entire down move today it acted as resistance... now its currently at 1171.00 and rising ,and could be acting as support. You will see this over and over at short term trends.So im watching closely here to see if it holds
dam, cant take a chance here.. exited the other a little late at 1169.50,plus one handle... still down a little less than 2 on the day...watching
Bruce I find him to be the most thoughtful, accurate and flexable analyst I have ever seen. His Sat audio updates are complete and concise. He has been calling for March 20 high to be followed by a short correction leading to an Aug 20 high which you better get out of the way. This call is over 6 mos old. New Lows, maybe and lasting for a major cycle.
Emini Day Trading /
Daily Notes /
Forecast /
Economic Events /
Search /
Terms and Conditions /
Disclaimer /
Books /
Online Books /
Site Map /
Contact /
Privacy Policy /
Links /
About /
Day Trading Forum /
Investment Calculators /
Pivot Point Calculator /
Market Profile Generator /
Fibonacci Calculator /
Mailing List /
Advertise Here /
Articles /
Financial Terms /
Brokers /
Software /
Holidays /
Stock Split Calendar /
Mortgage Calculator /
Donate
Copyright © 2004-2023, MyPivots. All rights reserved.
Copyright © 2004-2023, MyPivots. All rights reserved.