ES Short Term Trading 5/5/10
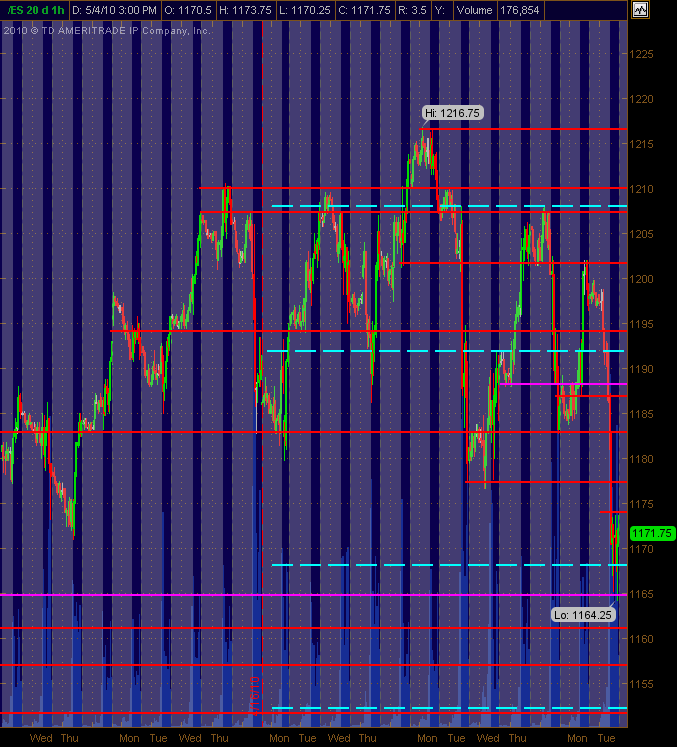
Have adjusted PASR lines that I see for potential support and/or resistance in Red with Magenta as "semi-significant" ... the Cyan dashed lines are the Weekly Pivot levels on the 30m chart that shows 24 hour trading with the gray background areas being overnight trading. Hope they're helpful as a map for Wednesday's trading.
Click image for original size
Btw, looking at the major cash indices on the Daily charts, it’s interesting that many came down to (or extremely close to) their 50 Day Simple Moving Averages at their lows today and closed a tad above those lows. Here they are:
SP-500
SP-100
Dow Industrials
Nasdaq Composite
Nasdaq-100
Wilshire 5000
Others still have a little air (but not much) between their lows today (5/4/10) and their 50 Day SMA:
Russell 2000
SP-400 Midcap
SP-600 Smallcap
Just an observation of the different indices and where they are after a helluva down day in the markets. Perhaps it may be an area for a bounce, even if things eventually break below the 50 day sma. Something to watch.
That's some big whoop-ass volume at 69 -70.( key zone)...what I thought was interesting was that we had peak volume up at 79 for a large portion of the day but then it changed to 1170 and they closed above that number. The Ym and Nq both closed above their peak volume and closed in the "air pocket " range.
I think we are gonna be left out and they are gonna fill in the Air and much higher overnight......I think the smart money was buying for longer term up move again..and they may be early..at least back to the 93 - 96 area..
We'll see...I was completely wrong premarket so perhaps they will make it easier on Wednesday.....
Other key zone up top is 85 - 87...
Ok, here's my daily 2 cents:
There's now a very large 'bearish' volume on the lower part of the RTH range - a long liquidation. Although I'm now a bit long term bearish (the daily bars broke the diamond formation), I believe this thing will bounce back in the coming days to do what they call "kissing the trend goodbye".
I don't want to be a long term short yet or I get my ass kicked. Instead I'm looking to go long. My target will be the "air pocket fill" up to 1177. Levels up to 1182 are also good targets.
I still believe this thing has a capability to retrace and close the gap and beyond before it eventually fail.
Here's my homework for Wednesday:
Notes:
- 20d EMA for SPY corresponds to 1187-ish for ES
- 1174-1175 area is also potential resistance, as buying shut off there several times on Tues.
- My guesstimate for tomorrow's range is 1163 - 1187
- If the January pullback is used as a yardstick, this correction could go all the way down to 1116 before resuming the uptrend.
Click image for original size
Notes:
- 20d EMA for SPY corresponds to 1187-ish for ES
- 1174-1175 area is also potential resistance, as buying shut off there several times on Tues.
- My guesstimate for tomorrow's range is 1163 - 1187
- If the January pullback is used as a yardstick, this correction could go all the way down to 1116 before resuming the uptrend.
The biggest issue I have today involves logic......if we assume price at time equals value then the market is saying "hey man, we are spending time consolidating below last weeks low and can't rally in the overnight...so we are ok with the percieved value"
If it was such a bargain to buy down here then I would have wanted them to move it away swiftly...
If it was such a bargain to buy down here then I would have wanted them to move it away swiftly...
key numbers for me as of 7:45
92 - 93 *****ledge and air pocket also R1...YD O/N midpoint
87.25 air pocket
83.50 air pocket
1175 air pocket and ONH and key number
1179 ****PV and high volume from yesterday before 1170 took over HV lead
1170 ***** top dog highest volume but was it really buyers....careful fading a swift move away from here
64 - 61 area where they will try and suck in shorts
starting longs at the 64.50 print....targeting that 70 volume ultimately....hopefully I'm not too early like yesterday
i'm not fighting the grain. this move is early so it can easily reverse, however, the trend is now down. fear is stronger then greed and after long move up there might be some scrambling to take profits. the cnbc crowd came home last night and saw the "bad" news about the largest loss in quite a while. market likely will have a hard time mustering up buyers this high up.
of course any down move has violent up moves. i was hoping the globex pushed up a little higher, perhaps 81, however it makes sense why it didn't.
now all the moving avgs are caught up.....it has more room to push down.
of course any down move has violent up moves. i was hoping the globex pushed up a little higher, perhaps 81, however it makes sense why it didn't.
now all the moving avgs are caught up.....it has more room to push down.
Today is a Don Miller MATD (morning after trend day), I know there is a definition of this in the dictionary, but does anyone have any other insights for trading day after trend day?
The one thing I do remember is that after a trend day down (with monster loss),
my note, Don's favorite set-up is described in 03/09/09 TD blog:
1) monster decline previous day
2) next day, gap down to prior day support, BUY tick under -720
One question that must be answered: What is "prior day" support? ...area of yesterday's Low: Low yesterday was 1164.25.
I have a friend who always expects close to a 50% retracement of the previous day's RTH range on a day following a trend day, but I have not quantified his expectations.
FYI: 50% of yesterdays RTH range = 1174.88
Bruce, thanks for you explanation of 1min bars yesterday.
here is a daily chart with some of my thinking. screen is only large enough to show last drop, but the other daily drops look the same. several days of decline but has moves back up to the daily 5ema and hugs the line for the duration of the move.
Click image for original size

you got a bad attitude man ! Call it what you like!!
Originally posted by ak1
Originally posted by BruceM
can you get us a visual on your air concept..I don't see it....perhaps we need to call it AK1 air so we don't confuse folks...Originally posted by ak1
Air at 1163
I like the name. Thanks. I can't give the visual as you need to watch a 30 min chart to catch it. It occures at the high and low of a recent 30 min candle. When we hit these levels we must go back 2 ticks. If we do not then we have air. I usually let this run for 4 points and then enter hoping to fill the air.
Emini Day Trading /
Daily Notes /
Forecast /
Economic Events /
Search /
Terms and Conditions /
Disclaimer /
Books /
Online Books /
Site Map /
Contact /
Privacy Policy /
Links /
About /
Day Trading Forum /
Investment Calculators /
Pivot Point Calculator /
Market Profile Generator /
Fibonacci Calculator /
Mailing List /
Advertise Here /
Articles /
Financial Terms /
Brokers /
Software /
Holidays /
Stock Split Calendar /
Mortgage Calculator /
Donate
Copyright © 2004-2023, MyPivots. All rights reserved.
Copyright © 2004-2023, MyPivots. All rights reserved.