ES Short Term Trading 5/5/10
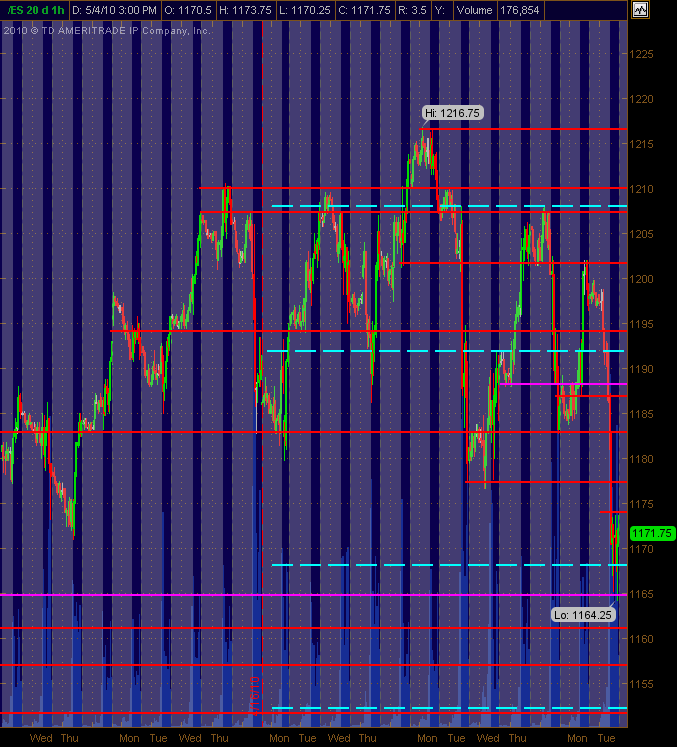
Have adjusted PASR lines that I see for potential support and/or resistance in Red with Magenta as "semi-significant" ... the Cyan dashed lines are the Weekly Pivot levels on the 30m chart that shows 24 hour trading with the gray background areas being overnight trading. Hope they're helpful as a map for Wednesday's trading.
Click image for original size
Click image for original size
whew..close one..there is the midpoint print....C'm 69....and then 92.50....
I MISS TYPED.. IT SHOULD READ THURS THE 6TH
Click image for original size

the 10pt players from 1157 may try and push this back down a bit,, as 1167 was also a reaction point from o/n GLOBEX session.
Pretty bullish if price overcomes 1167
Pretty bullish if price overcomes 1167
let see if the markets can hold the open print.... to push out the Hour highs...59 - 60.25 is support if we are to keep going..
sometimes it seems to come down to which price will be the stronger attractor....the volume that built at 59.50 from today or that huge 69-70 from yesterday....if we could fiqure that out we'd be printing money...LOL
sometimes it seems to come down to which price will be the stronger attractor....the volume that built at 59.50 from today or that huge 69-70 from yesterday....if we could fiqure that out we'd be printing money...LOL
still only one plus 800 tick....sure doesn't seem like a great rally...59 is coming..
Two day symetry for those interested....YD high at 1185 to peak volume at 1170 is 15 ponts.....then from 70 to current low is 15 points
Managing three runners with a crappy stop as usual.....
here is sym chart
Managing three runners with a crappy stop as usual.....
here is sym chart
Click image for original size

not my usual type entry. but i got long at 62.75. looked like a lot of strength when it hit that 57. so i figured wait for a small retracement when it hit the moving avg.
it really popped out of that area. i'm following closely but 1st target is gap fill. 2nd is 77
it really popped out of that area. i'm following closely but 1st target is gap fill. 2nd is 77
crappy 60 minute high and open print is holding...Volume switched peak to 65....so more interests at higher prices now..sounds good in theory and hopefully they won't jerk it around back to 65 after the hour breakout...just keep runningto 69..!
you got a bad attitude man ! Call it what you like!!
Originally posted by ak1
Originally posted by BruceM
can you get us a visual on your air concept..I don't see it....perhaps we need to call it AK1 air so we don't confuse folks...Originally posted by ak1
Air at 1163
I like the name. Thanks. I can't give the visual as you need to watch a 30 min chart to catch it. It occures at the high and low of a recent 30 min candle. When we hit these levels we must go back 2 ticks. If we do not then we have air. I usually let this run for 4 points and then enter hoping to fill the air.
Emini Day Trading /
Daily Notes /
Forecast /
Economic Events /
Search /
Terms and Conditions /
Disclaimer /
Books /
Online Books /
Site Map /
Contact /
Privacy Policy /
Links /
About /
Day Trading Forum /
Investment Calculators /
Pivot Point Calculator /
Market Profile Generator /
Fibonacci Calculator /
Mailing List /
Advertise Here /
Articles /
Financial Terms /
Brokers /
Software /
Holidays /
Stock Split Calendar /
Mortgage Calculator /
Donate
Copyright © 2004-2023, MyPivots. All rights reserved.
Copyright © 2004-2023, MyPivots. All rights reserved.