ES Short Term Trading 5/5/10
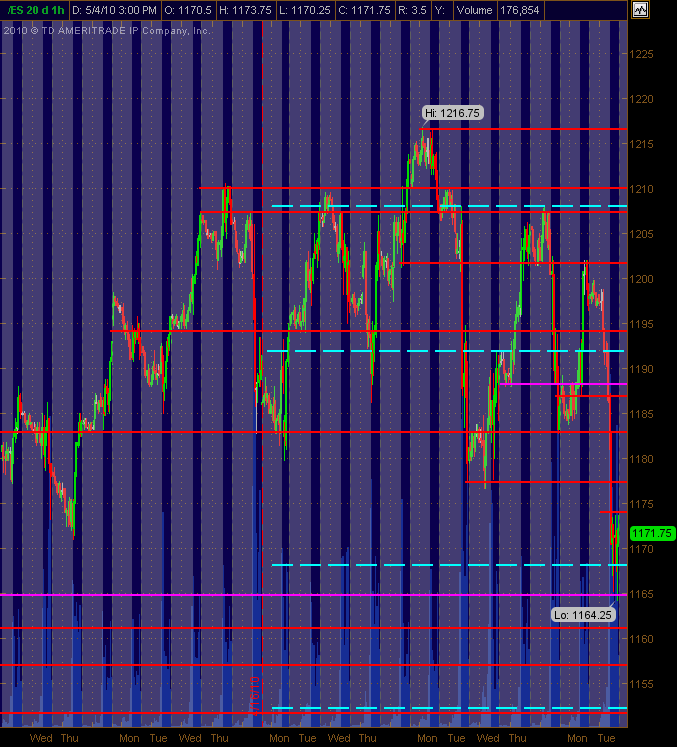
Have adjusted PASR lines that I see for potential support and/or resistance in Red with Magenta as "semi-significant" ... the Cyan dashed lines are the Weekly Pivot levels on the 30m chart that shows 24 hour trading with the gray background areas being overnight trading. Hope they're helpful as a map for Wednesday's trading.
Click image for original size
Click image for original size
I see -ve TICKs producing higher lows. Therefore, for now buyers in control, unless we break below VWAP again.
Bruce ,great call on the 1165 area!
nq still below it's peak volume from yesterday...it will be interesting to see what happens if it prints up there on this push
I'm on baby patrol so I'm not taking trades here
I'm on baby patrol so I'm not taking trades here
crazy crazy crazy. wow. market is strange!
I have 71.75 for last (closing trade, unadjusted for any special settlement junk), does anyone else hove something different for yesterday's 4:15 close?
thus, gap is filled.
thus, gap is filled.
agree Paul...Nq hits it's volume on that gap fill with 1200 plus $ticks...
Originally posted by PAUL9
I have 71.75 for last (closing trade, unadjusted for any special settlement junk), does anyone else hove something different for yesterday's 4:15 close?
thus, gap is filled.
Bruce, even though you ref NQ, the $TICK you are refernecing is NYSE?
I haven't done any studies on gap fills for the NQ,
today, I notice that NQ has not filled yet (4:15 close I have is 1969.75 for NQ)
I haven't done any studies on gap fills for the NQ,
today, I notice that NQ has not filled yet (4:15 close I have is 1969.75 for NQ)
cool day..they're gonna get that 75 - 77 we wanted so much YD
i'm out. this is actually an interesting point. side lines until it's clear. but i think i'm done for the day anyways.
great calls everyone!
great calls everyone!
1168 has 1 tick air
you got a bad attitude man ! Call it what you like!!
Originally posted by ak1
Originally posted by BruceM
can you get us a visual on your air concept..I don't see it....perhaps we need to call it AK1 air so we don't confuse folks...Originally posted by ak1
Air at 1163
I like the name. Thanks. I can't give the visual as you need to watch a 30 min chart to catch it. It occures at the high and low of a recent 30 min candle. When we hit these levels we must go back 2 ticks. If we do not then we have air. I usually let this run for 4 points and then enter hoping to fill the air.
Emini Day Trading /
Daily Notes /
Forecast /
Economic Events /
Search /
Terms and Conditions /
Disclaimer /
Books /
Online Books /
Site Map /
Contact /
Privacy Policy /
Links /
About /
Day Trading Forum /
Investment Calculators /
Pivot Point Calculator /
Market Profile Generator /
Fibonacci Calculator /
Mailing List /
Advertise Here /
Articles /
Financial Terms /
Brokers /
Software /
Holidays /
Stock Split Calendar /
Mortgage Calculator /
Donate
Copyright © 2004-2023, MyPivots. All rights reserved.
Copyright © 2004-2023, MyPivots. All rights reserved.