ES Short Term Trading 5/5/10
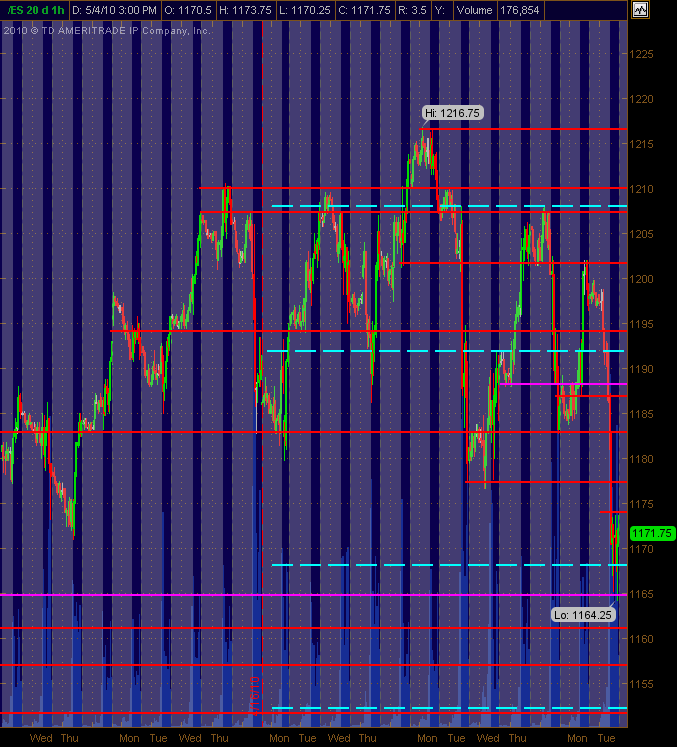
Have adjusted PASR lines that I see for potential support and/or resistance in Red with Magenta as "semi-significant" ... the Cyan dashed lines are the Weekly Pivot levels on the 30m chart that shows 24 hour trading with the gray background areas being overnight trading. Hope they're helpful as a map for Wednesday's trading.
Click image for original size
yes that is NYSE $tick...i was looking atthe correlation of thge markets....to see how one may impact the other...I think it would be strange to just blow through that kind of volume but if we did and I was active I'd want to trade for a retest of 70- 69 from above
Trying to stay loose with my one contract that I really want to hold for 92.50........probably not today...lol...I just suck with stops on runnesr...one good thing about baby patrol and typing on forums is that it helps get your eyes off the market....
Trying to stay loose with my one contract that I really want to hold for 92.50........probably not today...lol...I just suck with stops on runnesr...one good thing about baby patrol and typing on forums is that it helps get your eyes off the market....
I hope someone caught the fade to get that air at 69.50
i thought about it but initially didn't look like a lot of risk to reward w/ all the energy and support below. i would not be surprised however to see a retest of the lows, if not new lows.
i'm back on the long side at 67. i was wanting the 65 but was on the phone w/ HP trying to get my crappy printer replaced.
i'm going to keep these contracts for a while. if it goes up from here then no reason why all that empty space can't be filled in.
i'm going to keep these contracts for a while. if it goes up from here then no reason why all that empty space can't be filled in.
i went ahead and got out breakeven. bad spot to try for something that is a reach. not much of a bounce.
daily trend is still down and can easily retest lows. if anything its in the middle and will require a lot of fighting to get either direction.
daily trend is still down and can easily retest lows. if anything its in the middle and will require a lot of fighting to get either direction.
What a squeeze at 1168
Ak1
What does your last post mean. I am confused by it. TIA Rburns
What does your last post mean. I am confused by it. TIA Rburns
First they created air at 1168 and then bounced around it for 1.5 hrs.
Click image for original size
Click image for original size
you got a bad attitude man ! Call it what you like!!
Originally posted by ak1
Originally posted by BruceM
can you get us a visual on your air concept..I don't see it....perhaps we need to call it AK1 air so we don't confuse folks...Originally posted by ak1
Air at 1163
I like the name. Thanks. I can't give the visual as you need to watch a 30 min chart to catch it. It occures at the high and low of a recent 30 min candle. When we hit these levels we must go back 2 ticks. If we do not then we have air. I usually let this run for 4 points and then enter hoping to fill the air.
Emini Day Trading /
Daily Notes /
Forecast /
Economic Events /
Search /
Terms and Conditions /
Disclaimer /
Books /
Online Books /
Site Map /
Contact /
Privacy Policy /
Links /
About /
Day Trading Forum /
Investment Calculators /
Pivot Point Calculator /
Market Profile Generator /
Fibonacci Calculator /
Mailing List /
Advertise Here /
Articles /
Financial Terms /
Brokers /
Software /
Holidays /
Stock Split Calendar /
Mortgage Calculator /
Donate
Copyright © 2004-2023, MyPivots. All rights reserved.
Copyright © 2004-2023, MyPivots. All rights reserved.