ES short term trading 5-6-10
Most of these are being generated from the weekly chart..
57.50 - O/N low , yesterdays afternoon rally point
62-64 - LTP in ON, VA low,PP and POCP
70 - all that volume and VA high
75 - 77 air pocket and R1 ...Magnet ******
85 - 87.50 air pocket and r2
94 - 98 combination of LTP's and HTP
****Gap at 66.25 in O/N data so those reading get short up here at 68.50...most still sleeping so you'll miss this one
Originally posted by MonkeyMeat
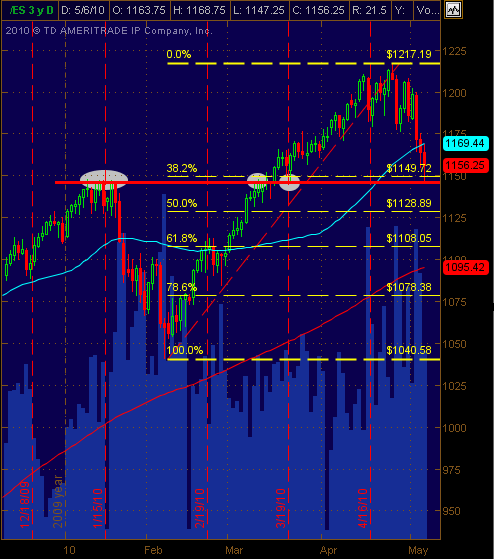
btw, 1145-1147 area pretty signif potential price action support on Daily ES chart (contin contract) ... cluster of January highs and some price action around there in March ... also noticed Daily S2 there as well
I've had this red support line on my 30min and Hourly charts for weeks and weeks. This is the Daily showing where/why I drew it in there fwiw.
Click image for original size
im short from 1157.00 and took one off at 155.00, but id really rather be a buyer today especially around 44! they need 51.50 even if theyre going higher imho!
There. Trying to break thru the 5 min red avg on the downside. It is at 1153.50
Raising my stop on the remainig es to b.e. ...1157.00
Click image for original size
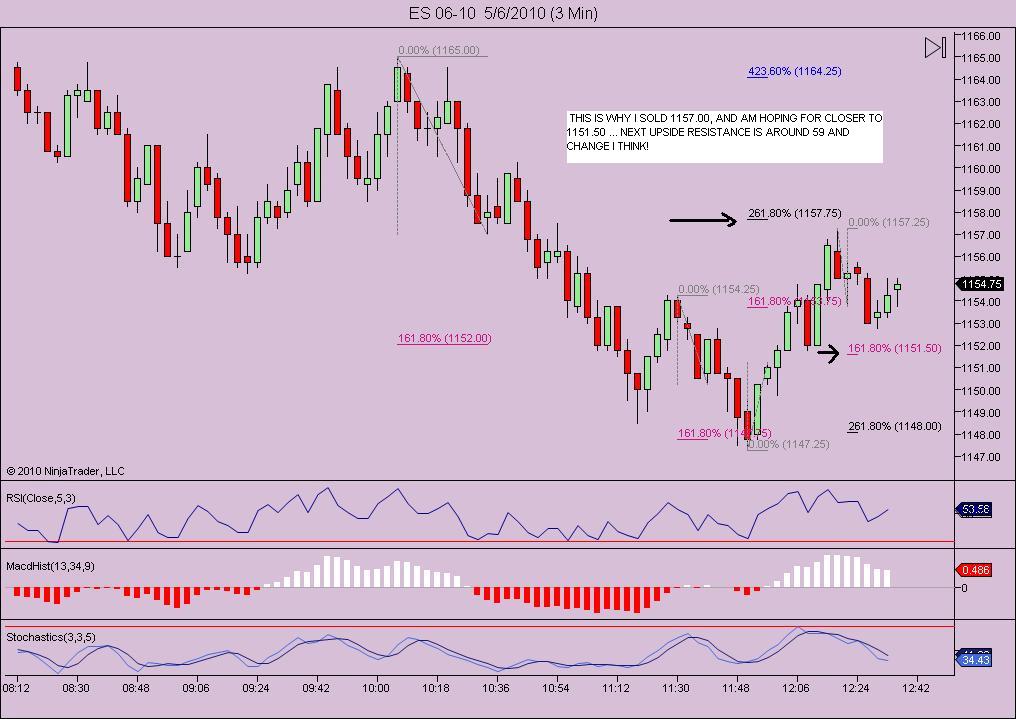
WOW...OUT AT 1152.00.. That was a lucky scalp!
Kinda looks like 13 -26 more min on the 13 min chart before a low!
Telling you.. around 1144 we will hit the low
believe it or not we havent quite hit the 5 day avg range yet! That comes in at 1145.25 if my math is good! still looking for 1144 like AK!
The real cause(?) for the market crash on May 06, 2010...
Read at Reuters..."Exclusive: Waddell is mystery trader in market plunge"
http://www.reuters.com/article/idUSTRE64D42W20100514
Read at Reuters..."Exclusive: Waddell is mystery trader in market plunge"
http://www.reuters.com/article/idUSTRE64D42W20100514
Emini Day Trading /
Daily Notes /
Forecast /
Economic Events /
Search /
Terms and Conditions /
Disclaimer /
Books /
Online Books /
Site Map /
Contact /
Privacy Policy /
Links /
About /
Day Trading Forum /
Investment Calculators /
Pivot Point Calculator /
Market Profile Generator /
Fibonacci Calculator /
Mailing List /
Advertise Here /
Articles /
Financial Terms /
Brokers /
Software /
Holidays /
Stock Split Calendar /
Mortgage Calculator /
Donate
Copyright © 2004-2023, MyPivots. All rights reserved.
Copyright © 2004-2023, MyPivots. All rights reserved.